TECHNICAL ASSET FINGERPRINT
9845019138b51c7b24023c9d
Click to view fullscreen
Press ESC or click to close
FOUND IN PAPERS
EXPERT: healer-alpha-free VERSION 1
RUNTIME: free/openrouter/healer-alpha
INTEL_VERIFIED
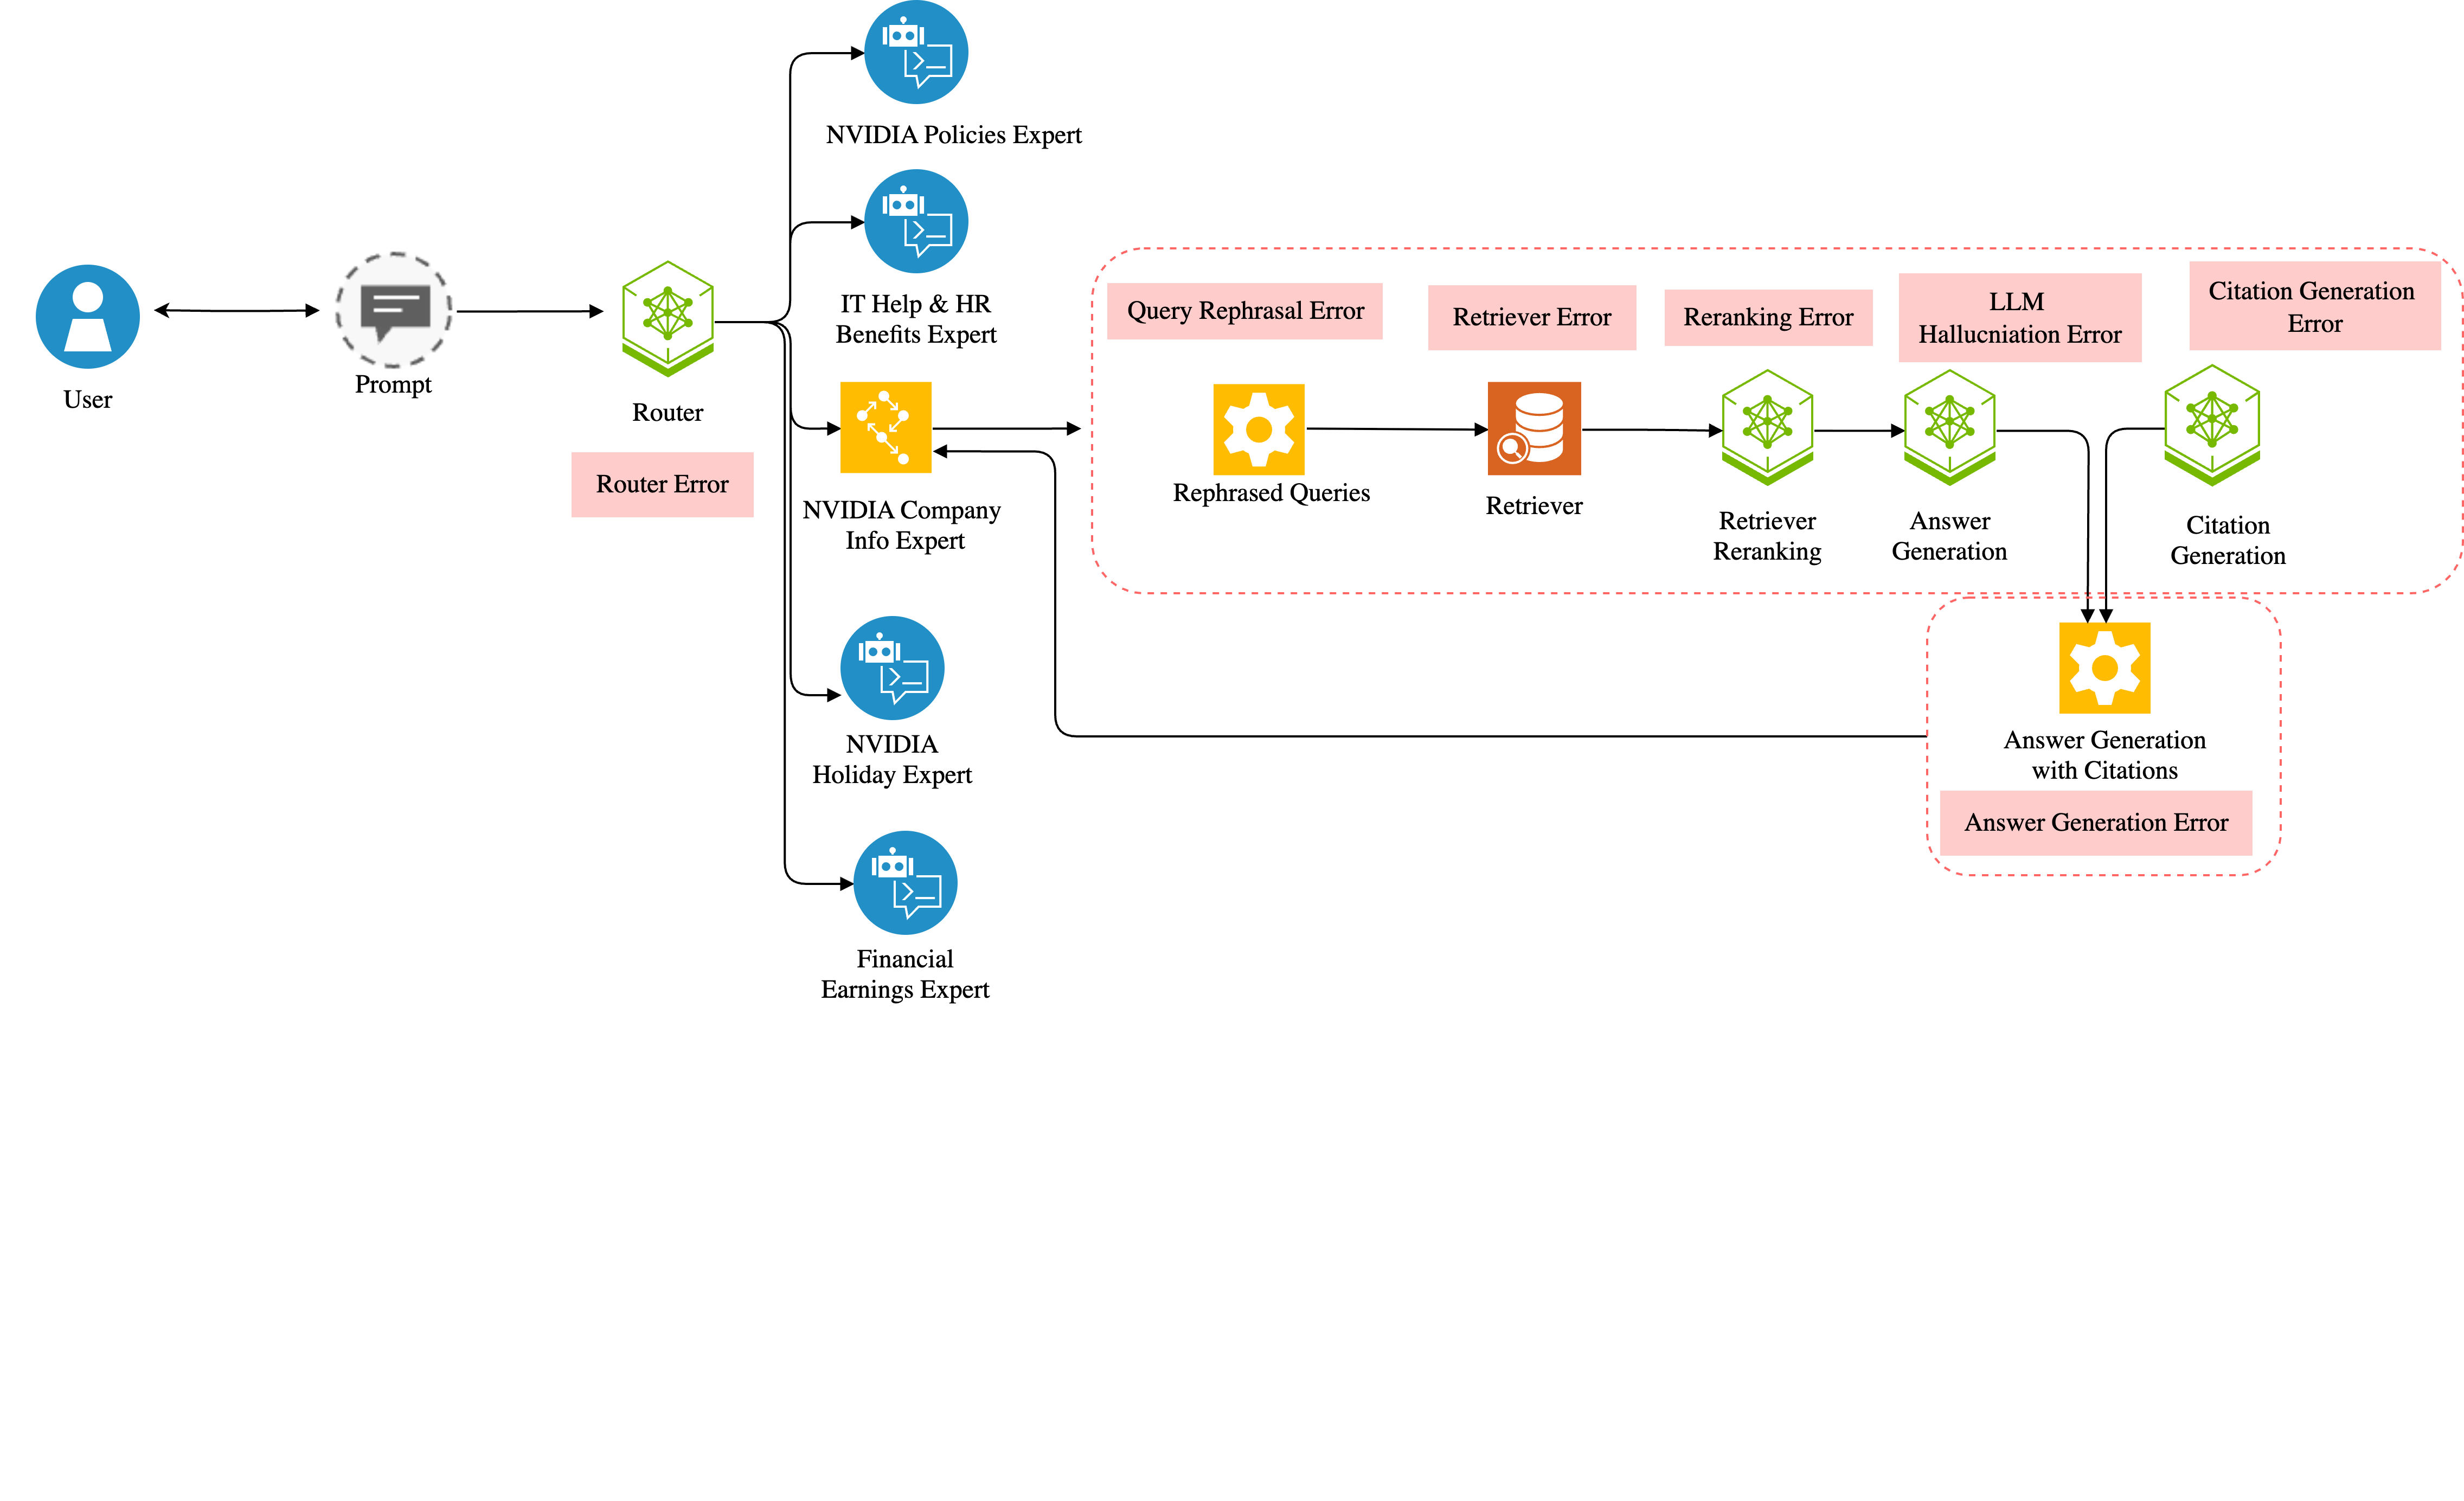
## [Diagram]: NVIDIA Expert System Architecture with Error Mapping
### Overview
This image is a technical flowchart diagram illustrating the architecture of a multi-expert question-answering system, likely for an internal NVIDIA knowledge base. The diagram maps the flow of a user's query through various specialized expert modules and a detailed processing pipeline, explicitly annotating potential error points at each stage.
### Components/Axes
The diagram is structured as a left-to-right flowchart with the following primary components and their spatial placements:
1. **User Input (Far Left):**
* **User Icon:** A blue circle with a white person silhouette, labeled "User".
* **Prompt Icon:** A grey speech bubble icon inside a dashed circle, labeled "Prompt".
* **Connection:** A double-headed arrow connects the User and Prompt icons.
2. **Routing Layer (Center-Left):**
* **Router Icon:** A green hexagonal icon with a network symbol, labeled "Router".
* **Error Annotation:** A pink rectangular box labeled "Router Error" is placed directly below the Router icon.
* **Connection:** A single arrow points from the Prompt to the Router.
3. **Expert Modules (Center):**
* Five expert modules branch out from the Router via a vertical line with horizontal arrows.
* **Top to Bottom:**
1. **NVIDIA Policies Expert:** Blue circle icon with a document and chat symbol.
2. **IT Help & HR Benefits Expert:** Blue circle icon with a document and chat symbol.
3. **NVIDIA Company Info Expert:** Yellow square icon with a network/hub symbol. This module has an additional, detailed sub-pipeline.
4. **NVIDIA Holiday Expert:** Blue circle icon with a document and chat symbol.
5. **Financial Earnings Expert:** Blue circle icon with a document and chat symbol.
4. **Detailed Processing Pipeline (Center-Right, for NVIDIA Company Info Expert):**
* This entire sub-pipeline is enclosed in a red dashed-line box.
* **Flow and Components (Left to Right):**
1. **Rephrased Queries:** Yellow gear icon. An arrow points from the NVIDIA Company Info Expert to this icon.
2. **Retriever:** Orange cylinder/database icon with a magnifying glass.
3. **Retriever Reranking:** Green hexagonal icon with a network symbol.
4. **Answer Generation:** Green hexagonal icon with a network symbol.
5. **Citation Generation:** Green hexagonal icon with a network symbol.
* **Error Annotations (Pink boxes above each component):**
* "Query Rephrasal Error" above Rephrased Queries.
* "Retriever Error" above Retriever.
* "Reranking Error" above Retriever Reranking.
* "LLM Hallucination Error" above Answer Generation.
* "Citation Generation Error" above Citation Generation.
5. **Final Output Stage (Far Right):**
* **Answer Generation with Citations:** A yellow gear icon. Arrows from both the "Answer Generation" and "Citation Generation" components point to this final icon.
* **Error Annotation:** A pink rectangular box labeled "Answer Generation Error" is placed below this final icon.
* **Return Flow:** A long arrow points from the "Answer Generation with Citations" icon back to the "NVIDIA Company Info Expert" icon, indicating the response is sent back through the routing system.
### Detailed Analysis
The diagram details a specific query processing flow for the "NVIDIA Company Info Expert":
1. A query is routed from the central **Router** to the **NVIDIA Company Info Expert**.
2. The expert's process begins with **Rephrased Queries** (potential for *Query Rephrasal Error*).
3. The rephrased query goes to the **Retriever** to fetch relevant documents (potential for *Retriever Error*).
4. Retrieved documents are processed by **Retriever Reranking** (potential for *Reranking Error*).
5. The ranked documents are used for **Answer Generation** (potential for *LLM Hallucination Error*).
6. In parallel or sequence, **Citation Generation** occurs (potential for *Citation Generation Error*).
7. The outputs from steps 5 and 6 are combined into the final **Answer Generation with Citations** (potential for a final *Answer Generation Error*).
8. The final answer is routed back to the expert module.
### Key Observations
1. **Modular Expert Design:** The system uses a router to direct queries to one of five specialized expert modules, each represented by a distinct icon.
2. **Explicit Error Mapping:** The diagram's primary purpose is to visualize potential failure points. Every processing step in the detailed pipeline is explicitly labeled with a corresponding error type in a pink box.
3. **Pipeline Complexity:** The "NVIDIA Company Info Expert" has a significantly more complex, multi-stage pipeline (Rephrase -> Retrieve -> Rerank -> Generate -> Cite) compared to the other experts, which are shown as single-step black boxes.
4. **Feedback Loop:** The final answer is returned to the originating expert module, suggesting a closed-loop system for response delivery.
### Interpretation
This diagram serves as a **system reliability and debugging map**. It doesn't show performance data but rather the architectural blueprint for identifying where things can go wrong in a Retrieval-Augmented Generation (RAG) system.
* **What it demonstrates:** It illustrates a sophisticated, enterprise-grade QA system that routes queries to domain-specific experts. The detailed breakdown for the company info expert highlights the multiple stages where errors can compound—from query understanding and retrieval to generation and citation.
* **Relationships:** The Router is the central dispatcher. The Experts are domain-specific handlers. The detailed pipeline shows the internal "gears" of one expert, revealing it's not a monolithic model but a chain of specialized components.
* **Notable Anomalies:** The most striking feature is the comprehensive error labeling. This suggests the diagram is likely used for:
* **System Monitoring:** To instrument and track error rates at each stage.
* **Root Cause Analysis:** To pinpoint whether a bad answer stems from poor retrieval, faulty reranking, or LLM hallucination.
* **Architectural Documentation:** To clearly communicate the system's complexity and potential vulnerabilities to engineers or stakeholders.
In essence, this is a **fault-tree analysis visualized as a system architecture diagram**. It prioritizes the mapping of failure modes over the depiction of successful data flow, making it a critical tool for maintaining and improving the system's accuracy and reliability.
DECODING INTELLIGENCE...