## Line Chart: Model Performance Across Mathematical Benchmarks
### Overview
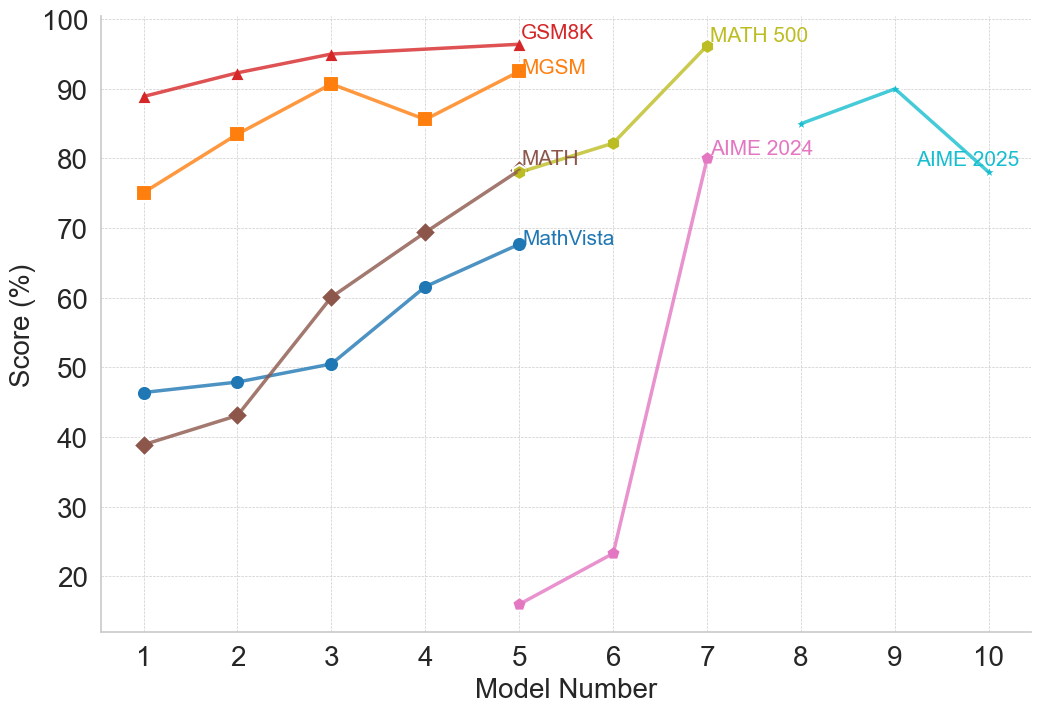
This image is a line chart displaying the performance scores of various numbered models across seven different mathematical reasoning benchmarks. The chart uses distinct colors and marker shapes for each benchmark, with labels placed directly adjacent to the data lines rather than in a separate legend box. The data spans across an x-axis representing sequential "Model Numbers" and a y-axis representing "Score (%)".
### Components/Axes
* **Y-Axis (Left):**
* **Label:** "Score (%)" (Rotated 90 degrees counter-clockwise).
* **Scale:** Ranges from 20 to 100, with major tick marks and labels at intervals of 10 (20, 30, 40, 50, 60, 70, 80, 90, 100). The axis line extends slightly below 20.
* **X-Axis (Bottom):**
* **Label:** "Model Number".
* **Scale:** Ranges from 1 to 10, with major tick marks and integer labels at every unit (1, 2, 3, 4, 5, 6, 7, 8, 9, 10).
* **Gridlines:** Faint, dashed, light gray gridlines intersect at every major tick mark on both the X and Y axes.
* **Legend/Labels:** There is no standalone legend. Series labels are color-coded to match their respective lines and are placed directly on the chart area near the end or middle of the data series.
### Detailed Analysis
*Note: All numerical values extracted from the chart are approximate based on visual interpolation of the gridlines.*
**1. Series: GSM8K**
* **Spatial Grounding:** Label is located at the top center, colored red, positioned just to the right of the final data point at x=5.
* **Visual Trend:** The red line with upward-pointing triangle markers starts very high, slopes gently upward, and plateaus slightly. Notably, there is no data point at x=4; the line connects directly from x=3 to x=5.
* **Data Points (x, y):**
* (1, ~89)
* (2, ~92)
* (3, ~95)
* (5, ~96.5)
**2. Series: MGSM**
* **Spatial Grounding:** Label is located in the upper middle, colored orange, positioned to the right of the final data point at x=5.
* **Visual Trend:** The orange line with square markers slopes upward from x=1 to x=3, experiences a distinct dip at x=4, and recovers with an upward slope to x=5.
* **Data Points (x, y):**
* (1, ~75)
* (2, ~83.5)
* (3, ~91)
* (4, ~86)
* (5, ~92.5)
**3. Series: MATH**
* **Spatial Grounding:** Label is located in the middle, colored brown, positioned to the right of the final data point at x=5.
* **Visual Trend:** The brown line with diamond markers starts relatively low and exhibits a steady, continuous upward slope, accelerating slightly between x=2 and x=4.
* **Data Points (x, y):**
* (1, ~39)
* (2, ~43)
* (3, ~60)
* (4, ~69.5)
* (5, ~78)
**4. Series: MathVista**
* **Spatial Grounding:** Label is located in the middle, colored blue, positioned to the right of the final data point at x=5.
* **Visual Trend:** The blue line with circular markers shows a very shallow upward slope from x=1 to x=3, followed by a steeper, consistent upward slope to x=5.
* **Data Points (x, y):**
* (1, ~46)
* (2, ~48)
* (3, ~50.5)
* (4, ~61.5)
* (5, ~68)
**5. Series: MATH 500**
* **Spatial Grounding:** Label is located at the top right, colored olive green, positioned to the right of the final data point at x=7.
* **Visual Trend:** The olive green line with small circular/dot markers begins exactly where the "MATH" series ends at x=5. It slopes upward to x=6, then sharply upward to x=7.
* **Data Points (x, y):**
* (5, ~78) *(Overlaps with the final point of the MATH series)*
* (6, ~82)
* (7, ~96)
**6. Series: AIME 2024**
* **Spatial Grounding:** Label is located on the right side, colored pink, positioned to the right of the final data point at x=7.
* **Visual Trend:** The pink line with small circular/dot markers starts at the lowest point on the entire chart at x=5. It slopes gently upward to x=6, followed by a massive, near-vertical spike to x=7.
* **Data Points (x, y):**
* (5, ~16)
* (6, ~23.5)
* (7, ~80)
**7. Series: AIME 2025**
* **Spatial Grounding:** Label is located on the far right, colored cyan, positioned below the line segment between x=9 and x=10.
* **Visual Trend:** The cyan line with star markers is the only series located on the far right of the x-axis. It slopes upward from x=8 to x=9, but then exhibits a sharp downward slope to x=10.
* **Data Points (x, y):**
* (8, ~85)
* (9, ~90)
* (10, ~78)
### Key Observations
* **Segmented X-Axis Domains:** The data is distinctly grouped by model numbers. Models 1-5 are tested on GSM8K, MGSM, MATH, and MathVista. Models 5-7 are tested on MATH 500 and AIME 2024. Models 8-10 are tested exclusively on AIME 2025.
* **Benchmark Saturation:** GSM8K starts near 90% and approaches 100%, indicating the benchmark is likely "solved" or saturated for these models.
* **Series Handoff:** The "MATH 500" series appears to act as a direct continuation of the "MATH" series, starting at the exact same coordinate (5, ~78).
* **Anomalous Drop:** The AIME 2025 series is the only benchmark that shows a significant performance degradation at the end of its curve (from Model 9 to Model 10).
* **Missing Data:** The GSM8K series skips Model 4 entirely.
### Interpretation
This chart illustrates the evolutionary progress of a series of AI models (likely a specific family of Large Language Models, given the sequential numbering 1 through 10) against standard mathematical reasoning benchmarks.
**Reading between the lines (Peircean Analysis):**
The chart tells a story of *benchmark obsolescence*. As models progress from 1 to 5, they rapidly master easier benchmarks like GSM8K and MGSM (approaching the 90-100% ceiling). Because these tests can no longer effectively differentiate the reasoning capabilities of newer models, researchers must introduce harder tests.
This is visually represented by the introduction of AIME 2024 and MATH 500 at Model 5. Model 5 scores highly on older tests but scores a dismal ~16% on AIME 2024. However, by Model 7, performance on AIME 2024 skyrockets to 80%. Consequently, an even harder benchmark, AIME 2025, is introduced for Models 8-10.
The drop in performance for Model 10 on AIME 2025 is a notable anomaly. It suggests that Model 10 might be a smaller, more efficient variant (e.g., a "mini" or "flash" model) rather than a direct capability scale-up from Model 9, or that a change in training methodology negatively impacted this specific type of complex mathematical reasoning.