## Line Chart: Model Performance Comparison
### Overview
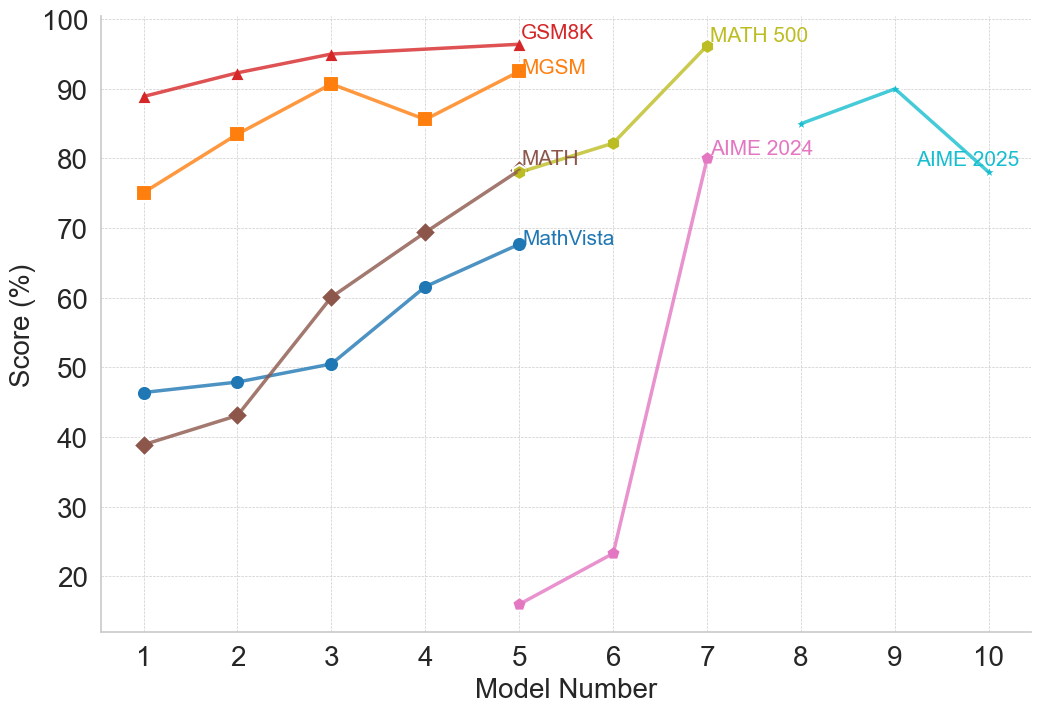
The image is a line chart comparing the performance of several models (GSM8K, MGSM, MATH, MathVista, MATH 500, AIME 2024, AIME 2025) across different model numbers (1 to 10). The y-axis represents the score in percentage (%), and the x-axis represents the model number. Each model's performance is plotted as a line, with different colors and markers distinguishing them.
### Components/Axes
* **X-axis:** Model Number, labeled from 1 to 10.
* **Y-axis:** Score (%), labeled from 20 to 100 in increments of 10.
* **Legend:** Located at the top of the chart, identifying each model by its name and corresponding line color/marker.
* GSM8K (Red line with triangle markers)
* MGSM (Orange line with square markers)
* MATH (Brown line with diamond markers)
* MathVista (Blue line with circle markers)
* MATH 500 (Yellow-Green line with no markers)
* AIME 2024 (Pink line with star markers)
* AIME 2025 (Teal line with star markers)
### Detailed Analysis
* **GSM8K (Red triangles):** Starts at approximately 89% at Model Number 1, increases to approximately 92% at Model Number 2, increases to approximately 95% at Model Number 3, and remains relatively stable around 96% for Model Numbers 4-6.
* **MGSM (Orange squares):** Starts at approximately 75% at Model Number 1, increases to approximately 84% at Model Number 2, increases to approximately 91% at Model Number 3, decreases to approximately 86% at Model Number 4, increases to approximately 93% at Model Number 5, and decreases to approximately 86% at Model Number 6.
* **MATH (Brown diamonds):** Starts at approximately 39% at Model Number 1, increases to approximately 43% at Model Number 2, increases to approximately 60% at Model Number 3, increases to approximately 69% at Model Number 4, increases to approximately 78% at Model Number 5.
* **MathVista (Blue circles):** Starts at approximately 47% at Model Number 1, increases to approximately 48% at Model Number 2, increases to approximately 51% at Model Number 3, increases to approximately 62% at Model Number 4, increases to approximately 68% at Model Number 5.
* **MATH 500 (Yellow-Green):** Starts at approximately 82% at Model Number 6, increases to approximately 97% at Model Number 7.
* **AIME 2024 (Pink):** Starts at approximately 16% at Model Number 5, increases to approximately 24% at Model Number 6, increases to approximately 80% at Model Number 7.
* **AIME 2025 (Teal):** Starts at approximately 87% at Model Number 8, increases to approximately 90% at Model Number 9, decreases to approximately 79% at Model Number 10.
### Key Observations
* GSM8K consistently performs well across all model numbers.
* MGSM shows some fluctuation in performance.
* MATH and MathVista show a general upward trend in performance as the model number increases.
* AIME 2024 shows a significant jump in performance between Model Numbers 6 and 7.
* MATH 500 only has two data points, showing high performance.
* AIME 2025 has three data points, showing a peak at Model Number 9.
### Interpretation
The chart provides a comparative analysis of different models' performance. GSM8K appears to be the most stable and high-performing model across the board. MATH and MathVista show improvement with increasing model number, suggesting potential learning or optimization. The dramatic increase in AIME 2024's performance between Model Numbers 6 and 7 is noteworthy and could indicate a significant change in the model's architecture or training data. The limited data points for MATH 500 and AIME 2025 make it difficult to assess their overall performance comprehensively. The data suggests that different models are suited for different tasks or have undergone different stages of development. Further investigation into the specific characteristics of each model and the nature of the tasks they are evaluated on would provide a more complete understanding of their relative strengths and weaknesses.