\n
## Line Chart: Model Performance on Various Benchmarks
### Overview
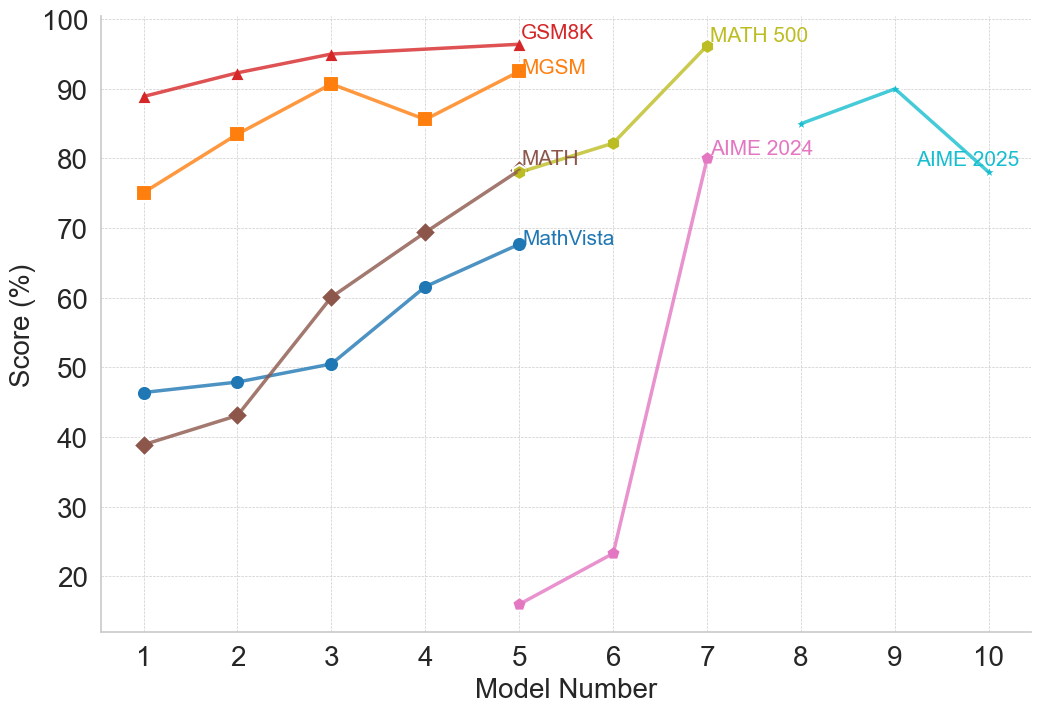
This line chart displays the performance scores (in percentage) of different models (numbered 1 to 10) across six different benchmarks: GSM8K, GSM, MATH 500, MATH, MathVista, AIME 2024, and AIME 2025. The chart allows for a comparison of how each model performs on each benchmark, and how performance changes as the model number increases.
### Components/Axes
* **X-axis:** "Model Number" ranging from 1 to 10.
* **Y-axis:** "Score (%)" ranging from 0 to 100.
* **Data Series:**
* GSM8K (Red)
* GSM (Orange)
* MATH 500 (Yellow)
* MATH (Olive Green)
* MathVista (Teal)
* AIME 2024 (Light Blue)
* AIME 2025 (Cyan)
* **Legend:** Located at the top-right of the chart, associating each color with its corresponding benchmark.
### Detailed Analysis
Here's a breakdown of each data series, with approximate values extracted from the chart:
* **GSM8K (Red):** The line starts at approximately 91% at Model 1, increases slightly to around 93% at Model 2, remains relatively stable around 92-93% until Model 5, then decreases to approximately 88% at Model 10.
* **GSM (Orange):** Starts at approximately 74% at Model 1, increases steadily to around 87% at Model 4, then plateaus around 86-88% for Models 5-10.
* **MATH 500 (Yellow):** Begins at approximately 42% at Model 1, increases steadily to around 75% at Model 5, peaks at approximately 97% at Model 7, and then declines to around 88% at Model 10.
* **MATH (Olive Green):** Starts at approximately 40% at Model 1, increases steadily to around 68% at Model 5, continues to increase to approximately 83% at Model 7, and then decreases slightly to around 80% at Model 10.
* **MathVista (Teal):** Starts at approximately 48% at Model 1, increases steadily to around 62% at Model 5, continues to increase to approximately 81% at Model 7, and then declines sharply to approximately 24% at Model 6 before increasing to around 85% at Model 9 and 83% at Model 10.
* **AIME 2024 (Light Blue):** Starts at approximately 81% at Model 1, increases to around 85% at Model 3, then decreases to approximately 78% at Model 5, increases sharply to approximately 91% at Model 7, and then decreases to around 88% at Model 10.
* **AIME 2025 (Cyan):** Starts at approximately 78% at Model 1, increases to around 82% at Model 3, then decreases to approximately 75% at Model 5, increases sharply to approximately 93% at Model 7, and then decreases to around 85% at Model 10.
### Key Observations
* **MATH 500** shows the most dramatic improvement between Model 5 and Model 7, achieving the highest score on the chart at Model 7.
* **MathVista** exhibits a significant drop in performance at Model 6, followed by a recovery in Models 9 and 10. This is an outlier.
* **GSM8K** maintains a consistently high score throughout all models.
* **AIME 2024 and AIME 2025** show similar trends, with a peak performance around Model 7.
* Generally, performance across all benchmarks improves as the model number increases, but this improvement plateaus or declines after a certain point (around Model 7).
### Interpretation
The data suggests that model performance generally improves with increasing model number, but the rate of improvement varies significantly depending on the benchmark. The substantial increase in MATH 500 performance between Models 5 and 7 indicates that this benchmark benefits significantly from model advancements within this range. The sharp decline in MathVista performance at Model 6 is an anomaly that warrants further investigation – it could be due to a specific issue with that model's implementation or a data-related problem. The convergence of AIME 2024 and AIME 2025 scores suggests that these benchmarks may be measuring similar capabilities. The plateauing or decline in performance after Model 7 suggests diminishing returns from further model development, or the need for different approaches to improve performance on these benchmarks. The chart provides valuable insights into the strengths and weaknesses of different models across various benchmarks, which can inform future model development and selection strategies.