\n
## Diagram: State Transition with Object Manipulation
### Overview
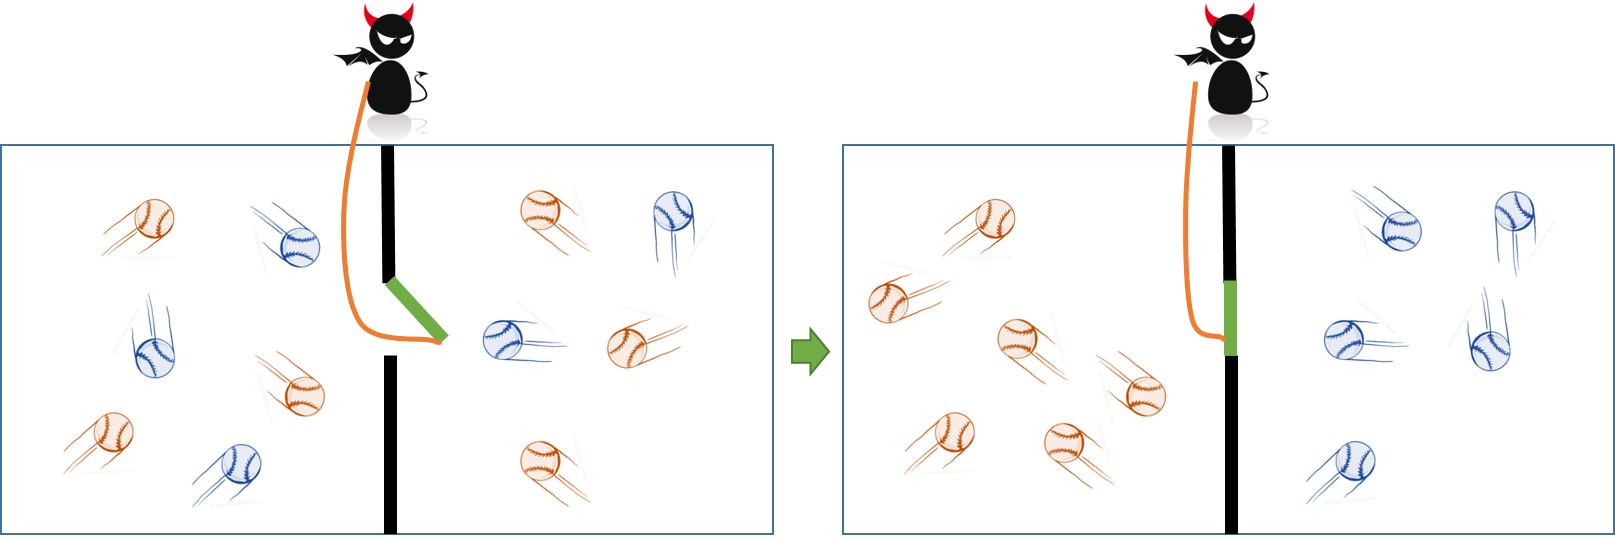
The image depicts a diagram illustrating a state transition. It shows two adjacent rectangular regions, representing different states, with objects (baseball-like shapes) scattered within them. A "devil" figure is positioned above both states, connected to an object within the first state via a colored line. An arrow between the two states indicates a transition. The diagram appears to demonstrate a process of object movement between states, potentially influenced by the "devil" figure.
### Components/Axes
The diagram consists of the following components:
* **States:** Two rectangular regions, visually separated.
* **Objects:** Numerous baseball-like shapes scattered within both states. These objects are rendered in varying orientations and colors (orange and blue).
* **"Devil" Figure:** A black silhouette of a devil with horns and a tail, positioned above both states.
* **Connecting Line:** An orange line originating from the "devil" figure and connecting to a green object in the first state.
* **Transition Arrow:** A green arrow pointing from the first state to the second state.
* **Vertical Line:** A black vertical line that appears to divide the two states.
* **Green Object:** A single green object in the first state.
There are no explicit axes or scales present in the diagram.
### Detailed Analysis or Content Details
The diagram shows a change in the distribution of objects between the two states.
**State 1 (Left):**
* Approximately 12 objects are visible.
* Approximately 7 objects are orange and 5 are blue.
* One object is green.
* The orange line from the devil connects to the green object.
* A black line extends from the top of the frame, down to the green object.
**State 2 (Right):**
* Approximately 10 objects are visible.
* Approximately 7 objects are orange and 3 are blue.
* The green object is no longer present.
The arrow indicates a transition from the left state to the right state. The orange line from the devil appears to "pull" the green object from the left state to the right state.
### Key Observations
* The green object is the only object that appears to move between states.
* The number of orange objects increases in the second state, while the number of blue objects decreases.
* The "devil" figure seems to be actively involved in the transition, as indicated by the connecting line.
* The diagram does not provide any quantitative data, only a visual representation of a state change.
### Interpretation
The diagram likely represents a simplified model of a system where an external influence ("devil") manipulates objects between different states. The green object could represent a specific resource or element that is being transferred. The increase in orange objects in the second state suggests that the transition process may involve a transformation or creation of new objects. The diagram could be illustrating a concept in game theory, control systems, or even a metaphorical representation of temptation and consequence. The lack of quantitative data makes it difficult to draw definitive conclusions, but the visual elements strongly suggest a dynamic process with a clear cause-and-effect relationship. The diagram is not providing facts or data, but rather a visual metaphor. The positioning of the devil above both states suggests it has influence over both, and the line connecting it to the green object indicates a direct interaction. The arrow signifies a change in state, and the altered distribution of objects implies a transformation during the transition.