## Diagram: Baseball Trajectory Analysis with Devil Figure
### Overview
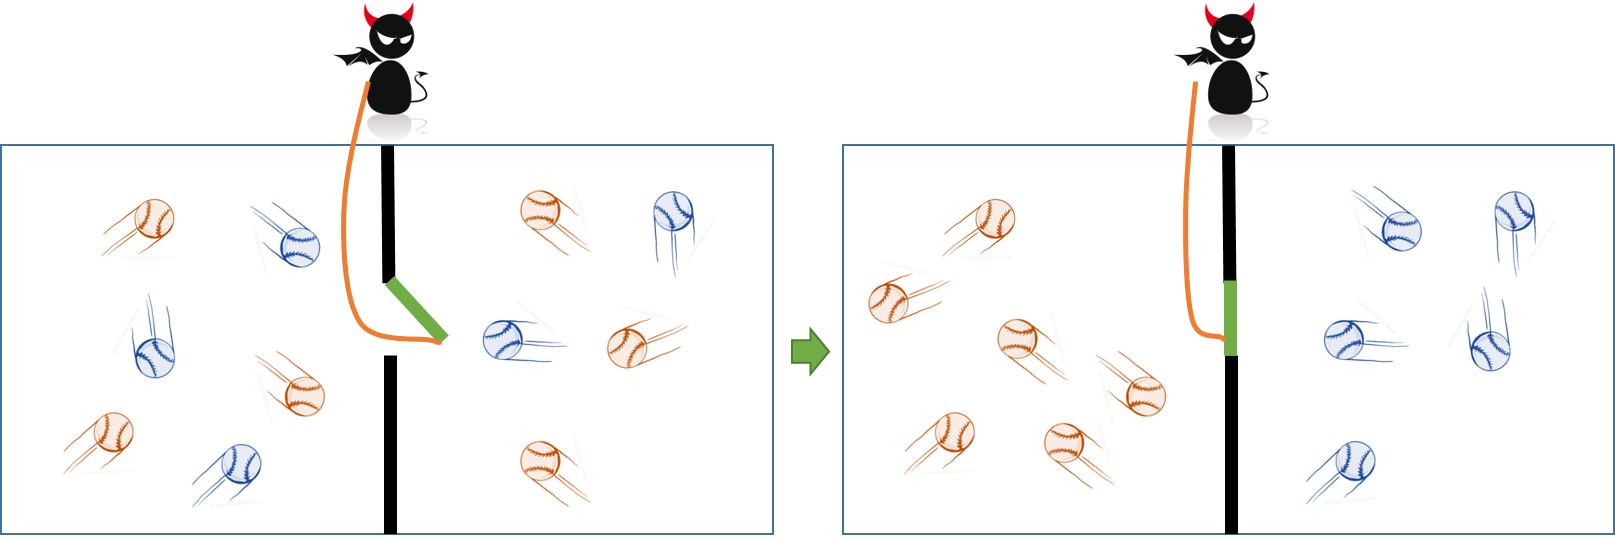
The image depicts a comparative analysis of baseball trajectories across two panels, separated by a vertical black line. A stylized devil figure (black silhouette with red horns) appears at the top of both panels, connected by an orange line to a green arrow. Baseballs are represented as white squares with blue/orange motion lines, suggesting velocity or spin. A green arrow between panels indicates a directional relationship.
### Components/Axes
- **Top Section**:
- Devil figure (black silhouette with red horns) positioned at the top center of both panels.
- Orange line connects the devil figure to a green arrow in the left panel.
- Green arrow points from left to right panel, suggesting a transformation or process.
- **Baseballs**:
- Left panel: 8 baseballs (4 blue motion lines, 4 orange motion lines).
- Right panel: 5 baseballs (3 blue motion lines, 2 orange motion lines).
- **Lines**:
- Orange line: Connects devil figure to green arrow in left panel.
- Green arrow: Spans between panels, positioned centrally.
- **Background**:
- Gray backdrop with blue borders around each panel.
- No axis labels, legends, or numerical scales visible.
### Detailed Analysis
- **Baseball Distribution**:
- Left panel: Higher density of baseballs (8 total) compared to right panel (5 total).
- Motion lines (blue/orange) indicate directionality, but no quantitative values are provided.
- **Color Coding**:
- Blue motion lines: Left panel (4), Right panel (3).
- Orange motion lines: Left panel (4), Right panel (2).
- No legend explains color significance.
- **Devil Figure**:
- Positioned identically in both panels, suggesting a constant variable or control.
- Orange line from devil figure to green arrow implies a causal or influencing relationship.
### Key Observations
1. **Reduction in Baseballs**: Right panel shows fewer baseballs (5 vs. 8), potentially indicating filtering or elimination.
2. **Motion Line Disparity**: Orange lines decrease from 4 to 2, while blue lines decrease from 4 to 3.
3. **Devil Figure Role**: Centralized position and connection to green arrow suggest it acts as a filter or process initiator.
4. **Green Arrow**: Implies a directional flow or transformation between panels.
### Interpretation
The diagram likely represents a process where the devil figure (possibly symbolizing a filter, algorithm, or external force) influences baseball trajectories. The reduction in baseballs and motion lines from left to right panel suggests:
- **Filtering Mechanism**: The devil figure may remove certain trajectories (orange lines) more aggressively than others (blue lines).
- **Velocity/Spin Correlation**: Orange lines (potentially higher velocity/spin) are reduced more than blue lines, implying a bias in the filtering process.
- **Directional Flow**: The green arrow emphasizes a before/after relationship, though the exact nature of the transformation remains ambiguous without textual labels.
### Limitations
- No textual labels, legends, or numerical data are present to confirm hypotheses.
- Color coding (blue/orange) lacks explanation, leaving interpretation speculative.
- Devil figure’s symbolic meaning is inferred visually rather than explicitly stated.
This analysis assumes the diagram represents a metaphorical or abstract process rather than literal data. For precise conclusions, additional context or textual annotations would be required.