## Line Graphs: Model Performance Across Interaction Counts
### Overview
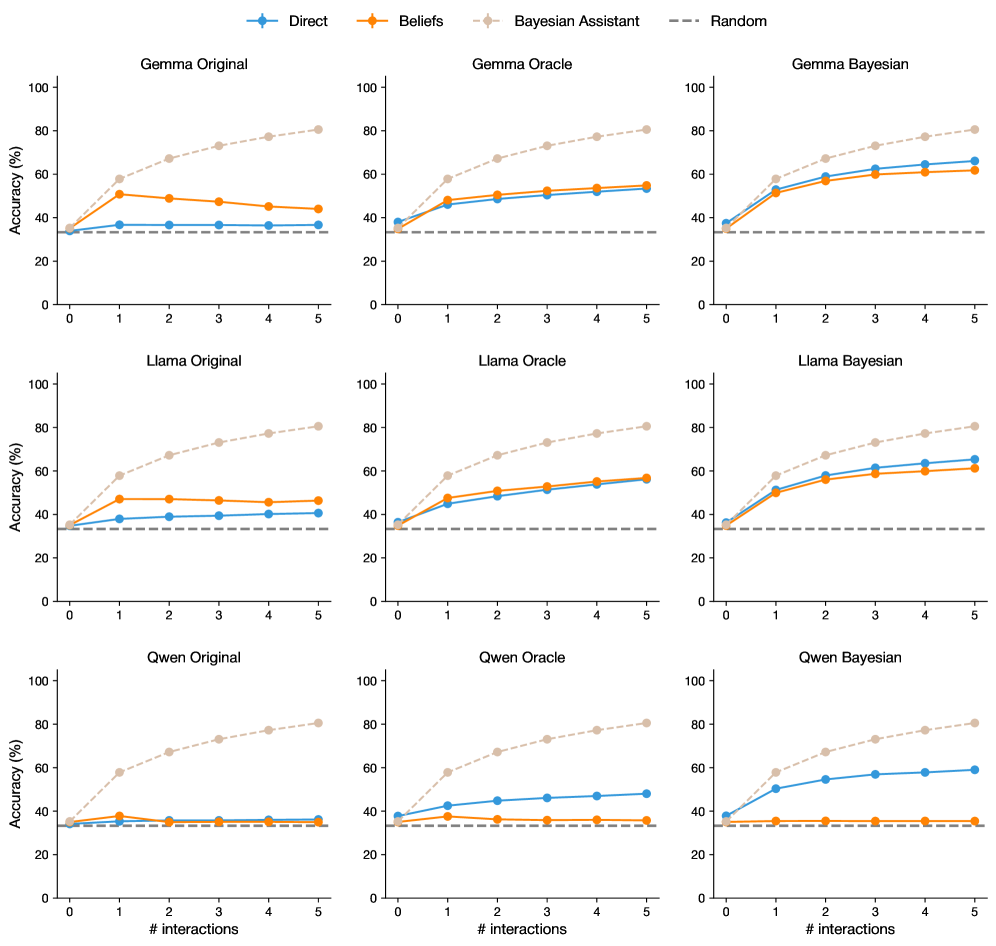
The image contains a 3x3 grid of line graphs comparing the accuracy of three AI models (Gemma, Llama, Qwen) across three configurations (Original, Oracle, Bayesian) over 5 interaction steps. Four performance metrics are tracked: Direct, Beliefs, Bayesian Assistant, and Random. Each graph shows distinct trends in accuracy improvement with increasing interactions.
### Components/Axes
- **X-axis**: "# interactions" (0–5, integer steps)
- **Y-axis**: "Accuracy (%)" (0–100, linear scale)
- **Legends**: Positioned at the top of each graph with four categories:
- **Direct** (blue circles)
- **Beliefs** (orange squares)
- **Bayesian Assistant** (beige diamonds)
- **Random** (gray dashed line)
- **Graph Titles**: Format = "[Model] [Configuration]" (e.g., "Gemma Original")
### Detailed Analysis
#### Gemma Original
- **Direct**: Starts at ~30%, rises to ~60% by interaction 5
- **Beliefs**: Peaks at ~50% (interaction 2), drops to ~45% by interaction 5
- **Bayesian Assistant**: Steady climb from ~30% to ~80%
- **Random**: Flat at ~30%
#### Gemma Oracle
- **Direct**: ~30% → ~50%
- **Beliefs**: Peaks at ~55% (interaction 3), drops to ~50%
- **Bayesian Assistant**: ~30% → ~75%
- **Random**: Flat at ~30%
#### Gemma Bayesian
- **Direct**: ~30% → ~65%
- **Beliefs**: Peaks at ~60% (interaction 3), drops to ~55%
- **Bayesian Assistant**: ~30% → ~85%
- **Random**: Flat at ~30%
#### Llama Original
- **Direct**: ~30% → ~50%
- **Beliefs**: Peaks at ~50% (interaction 2), drops to ~45%
- **Bayesian Assistant**: ~30% → ~80%
- **Random**: Flat at ~30%
#### Llama Oracle
- **Direct**: ~30% → ~55%
- **Beliefs**: Peaks at ~55% (interaction 3), drops to ~50%
- **Bayesian Assistant**: ~30% → ~75%
- **Random**: Flat at ~30%
#### Llama Bayesian
- **Direct**: ~30% → ~60%
- **Beliefs**: Peaks at ~60% (interaction 3), drops to ~55%
- **Bayesian Assistant**: ~30% → ~85%
- **Random**: Flat at ~30%
#### Qwen Original
- **Direct**: ~30% → ~50%
- **Beliefs**: Peaks at ~40% (interaction 1), drops to ~35%
- **Bayesian Assistant**: ~30% → ~80%
- **Random**: Flat at ~30%
#### Qwen Oracle
- **Direct**: ~30% → ~50%
- **Beliefs**: Peaks at ~40% (interaction 1), drops to ~35%
- **Bayesian Assistant**: ~30% → ~75%
- **Random**: Flat at ~30%
#### Qwen Bayesian
- **Direct**: ~30% → ~60%
- **Beliefs**: Peaks at ~50% (interaction 3), drops to ~45%
- **Bayesian Assistant**: ~30% → ~85%
- **Random**: Flat at ~30%
### Key Observations
1. **Bayesian Assistant Dominance**: Consistently achieves highest accuracy across all models and configurations, suggesting Bayesian methods significantly enhance performance.
2. **Direct vs. Beliefs**: Both metrics show initial improvement with interactions but plateau or decline after 3–4 steps, indicating diminishing returns.
3. **Random Baseline**: All models outperform the random baseline (30%) by interaction 1, demonstrating baseline effectiveness.
4. **Model-Specific Trends**:
- Qwen shows the most pronounced drop in Beliefs accuracy after peak
- Llama and Gemma maintain more stable Beliefs performance
- Bayesian configurations show 20–30% absolute improvement over Original/Oracle
### Interpretation
The data suggests Bayesian approaches (Bayesian Assistant) provide the most reliable accuracy gains, likely through probabilistic reasoning and uncertainty quantification. Direct and Beliefs metrics indicate that while interaction depth improves performance initially, excessive interactions may introduce noise or overfitting. The consistent Random baseline (30%) across all graphs implies these models outperform chance-level guessing by at least 30 percentage points. Notably, the Bayesian Assistant's performance improvement correlates with interaction count, suggesting it effectively leverages additional context. The Beliefs metric's volatility across models may reflect differences in how each architecture handles uncertainty representation.