## Line Graphs: KV Cache Selectivity and Heavy Hitter vs. Recent Window Selectivity
### Overview
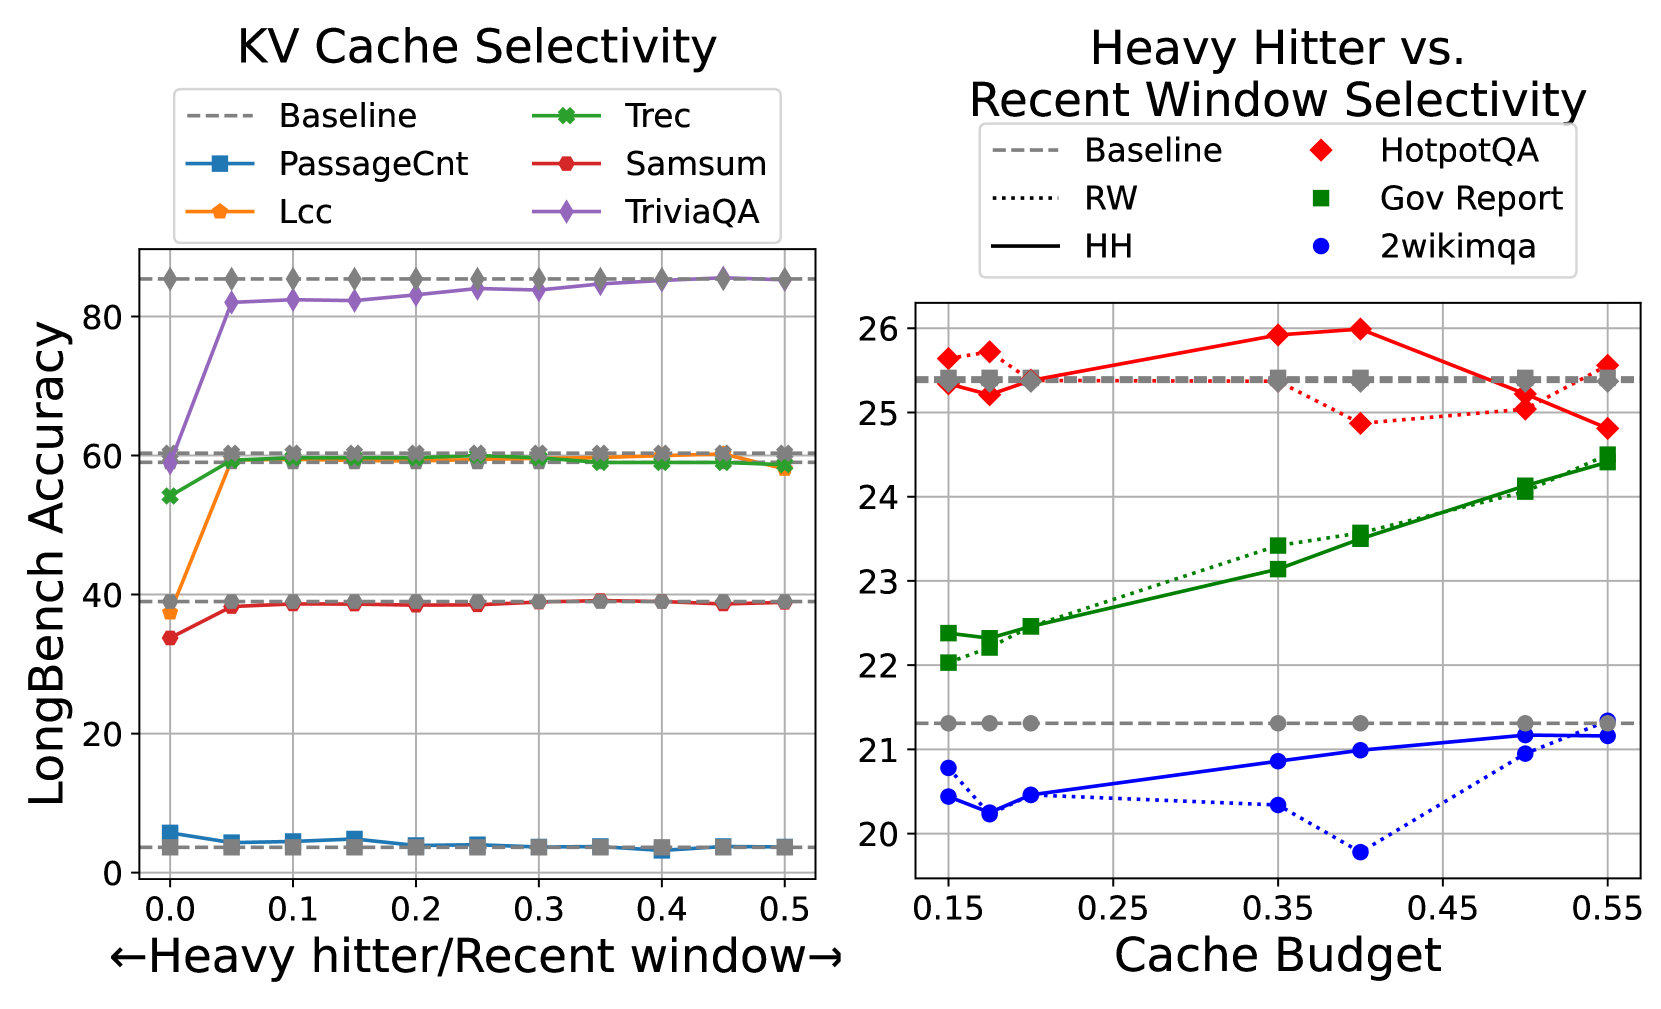
The image contains two line graphs comparing cache selectivity metrics across different datasets and cache budgets. The left graph focuses on "KV Cache Selectivity" with heavy hitter/recent window ratios on the x-axis, while the right graph examines "Heavy Hitter vs. Recent Window Selectivity" with cache budget percentages on the x-axis. Both graphs measure "LongBench Accuracy" on the y-axis.
### Components/Axes
**Left Graph (KV Cache Selectivity):**
- **X-axis**: Heavy hitter/Recent window (0.0 to 0.5)
- **Y-axis**: LongBench Accuracy (0 to 80)
- **Legend**:
- Baseline (gray dashed line)
- PassageCnt (blue square)
- Samsum (red circle)
- Trec (green circle)
- Lcc (orange diamond)
- TriviaQA (purple diamond)
**Right Graph (Heavy Hitter vs. Recent Window Selectivity):**
- **X-axis**: Cache Budget (0.15 to 0.55)
- **Y-axis**: LongBench Accuracy (20 to 26)
- **Legend**:
- Baseline (gray dashed line)
- HotpotQA (red diamond)
- Gov Report (green square)
- 2wikimqa (blue circle)
- RW (dotted gray line)
### Detailed Analysis
**Left Graph Trends:**
1. **Baseline**: Flat line at ~40 accuracy across all x-values.
2. **PassageCnt**: Starts at ~5 accuracy, drops sharply to near 0 by x=0.1, then stabilizes.
3. **Samsum**: Stable ~35-40 accuracy across all x-values.
4. **Trec**: Stable ~60 accuracy, with minor fluctuations.
5. **Lcc**: Stable ~60 accuracy, slightly higher than Trec at x=0.0.
6. **TriviaQA**: Sharp rise from ~60 to 80+ accuracy at x=0.1, then plateaus.
**Right Graph Trends:**
1. **Baseline**: Flat line at ~25 accuracy across all x-values.
2. **HotpotQA**: Starts at ~25, peaks at ~26 (x=0.35), then dips to ~25.5.
3. **Gov Report**: Rises steadily from ~22 to ~24.5 (x=0.55).
4. **2wikimqa**: Peaks at ~21.5 (x=0.25), drops to ~19 at x=0.4, then recovers to ~21.
5. **RW**: Flat line at ~21.5 accuracy.
### Key Observations
1. **Left Graph**:
- TriviaQA dominates with the highest accuracy (80+).
- PassageCnt performs worst, dropping to near-zero accuracy.
- Trec and Lcc show similar performance (~60 accuracy).
- Samsum and Baseline are comparable (~35-40 accuracy).
2. **Right Graph**:
- HotpotQA and Gov Report improve with higher cache budgets.
- 2wikimqa exhibits a significant dip at x=0.4 (cache budget 40%).
- RW remains consistently low (~21.5 accuracy).
### Interpretation
1. **Cache Budget Impact**:
- Higher cache budgets (x-axis) generally improve accuracy for HotpotQA and Gov Report, suggesting these datasets benefit from larger memory allocations.
- 2wikimqa's performance drop at x=0.4 indicates potential overfitting or resource inefficiency at mid-range budgets.
2. **Dataset Characteristics**:
- TriviaQA's high accuracy in the left graph suggests it is optimized for heavy hitter/recent window selectivity.
- PassageCnt's poor performance may reflect structural limitations in its cache management.
3. **Anomalies**:
- The sharp drop in PassageCnt accuracy at x=0.1 warrants investigation into dataset-specific bottlenecks.
- 2wikimqa's U-shaped curve in the right graph suggests non-linear scaling behavior.
4. **Design Implications**:
- Systems using TriviaQA or Gov Report may prioritize cache budget allocation.
- PassageCnt and 2wikimqa require architectural optimizations to mitigate performance gaps.