## Diagram: Data Request and Retrieval Process
### Overview
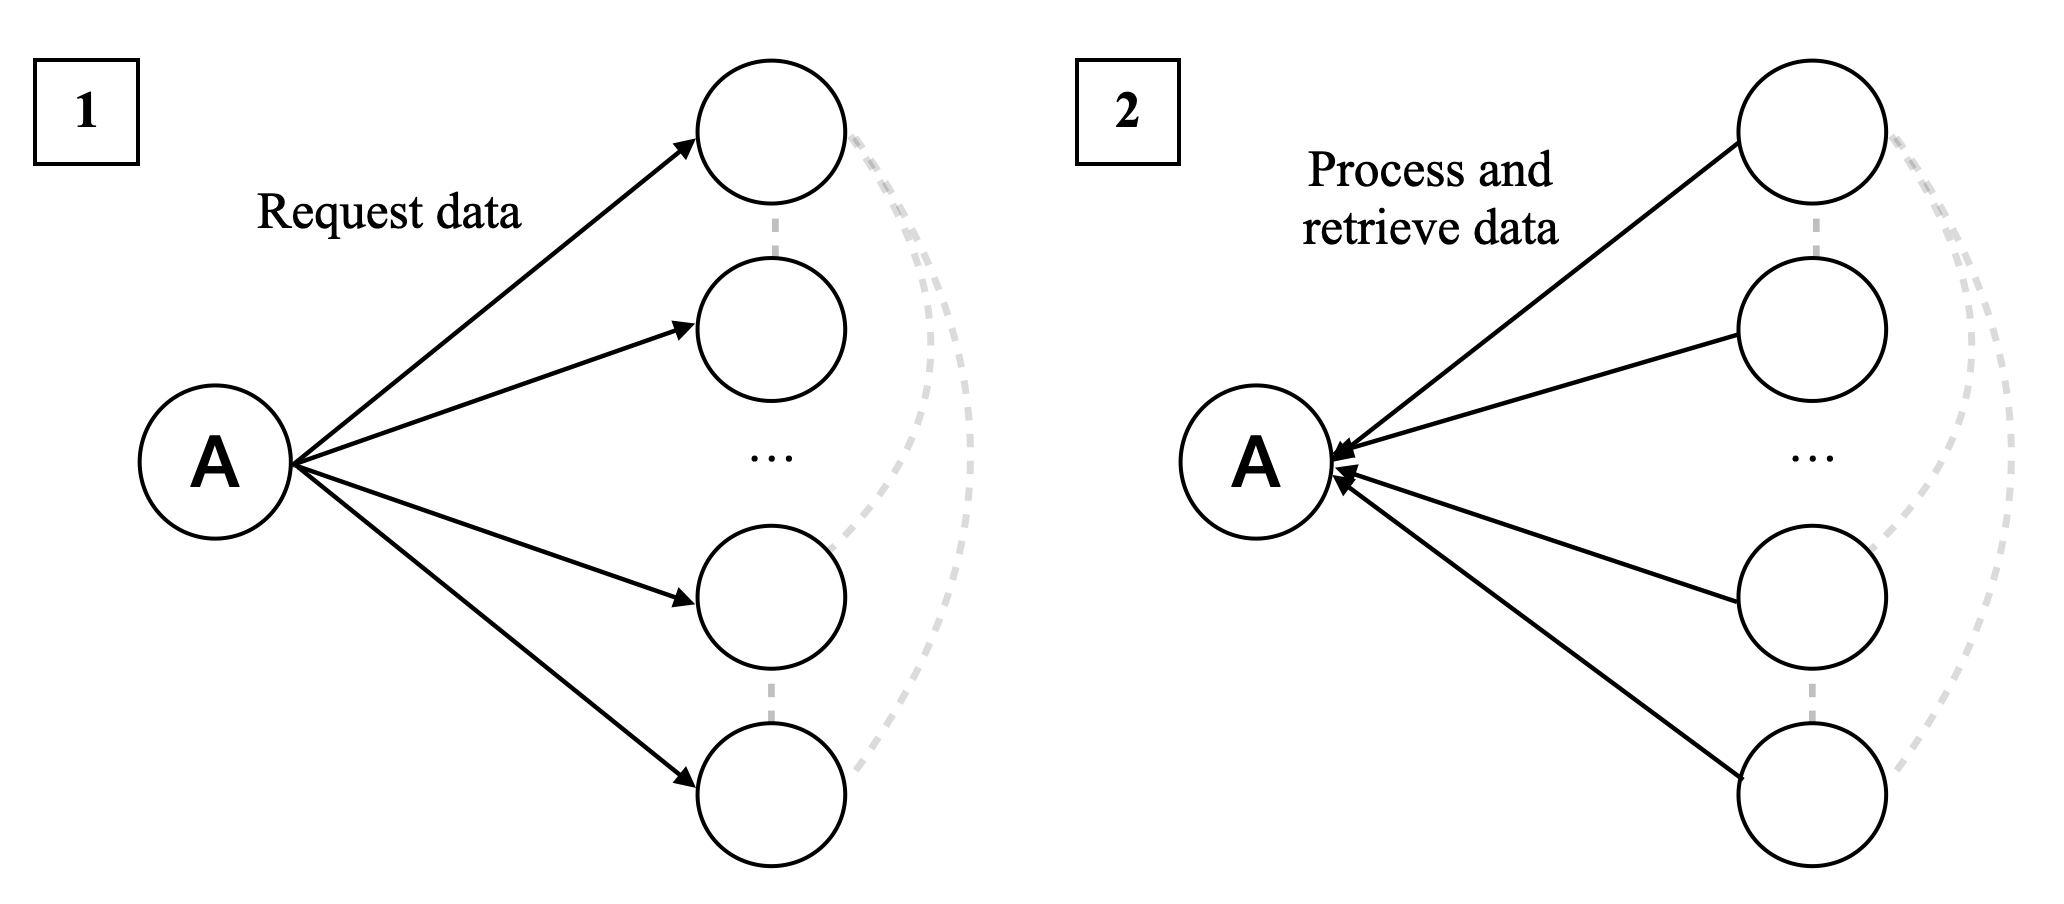
The image depicts a diagram illustrating a data request and retrieval process, divided into two stages. The first stage shows a central node 'A' requesting data from multiple sources. The second stage shows the same central node 'A' receiving data from those sources. A dashed line connects the data sources, suggesting a relationship or sequence.
### Components/Axes
* **Nodes:** The diagram contains circular nodes representing data sources or processes. One central node is labeled 'A' in both stages.
* **Arrows:** Solid arrows indicate the direction of data flow.
* **Dashed Line:** A dashed line connects the data sources, potentially indicating a sequence or relationship.
* **Labels:**
* Top-left of the first diagram: "1" inside a square.
* Next to the first diagram: "Request data".
* Top-left of the second diagram: "2" inside a square.
* Next to the second diagram: "Process and retrieve data".
* Ellipsis: A set of three dots "..." is present between two nodes in both diagrams, indicating that there may be more nodes than are shown.
### Detailed Analysis or ### Content Details
**Diagram 1: Request Data**
* Node 'A' has three solid arrows pointing away from it, each directed towards a separate circular node.
* There are four circular nodes on the right side of node 'A', with an ellipsis between the second and third node.
* A dashed line connects the four circular nodes on the right side.
**Diagram 2: Process and Retrieve Data**
* Node 'A' has three solid arrows pointing towards it, each originating from a separate circular node.
* There are four circular nodes on the left side of node 'A', with an ellipsis between the second and third node.
* A dashed line connects the four circular nodes on the left side.
### Key Observations
* The diagram illustrates a two-step process: first, data is requested from multiple sources, and then data is retrieved from those sources.
* Node 'A' acts as a central point for both requesting and receiving data.
* The dashed line connecting the data sources suggests a relationship or sequence between them.
### Interpretation
The diagram represents a common data processing pattern where a central entity (A) requests data from multiple sources, processes it, and then retrieves the processed data. The dashed line could represent a data pipeline, a sequence of operations, or a dependency between the data sources. The ellipsis indicates that the diagram is a simplified representation and that there may be more data sources involved in the actual process. The diagram highlights the flow of data and the central role of entity 'A' in managing the data request and retrieval process.