## Diagram: Data Request and Retrieval Process
### Overview
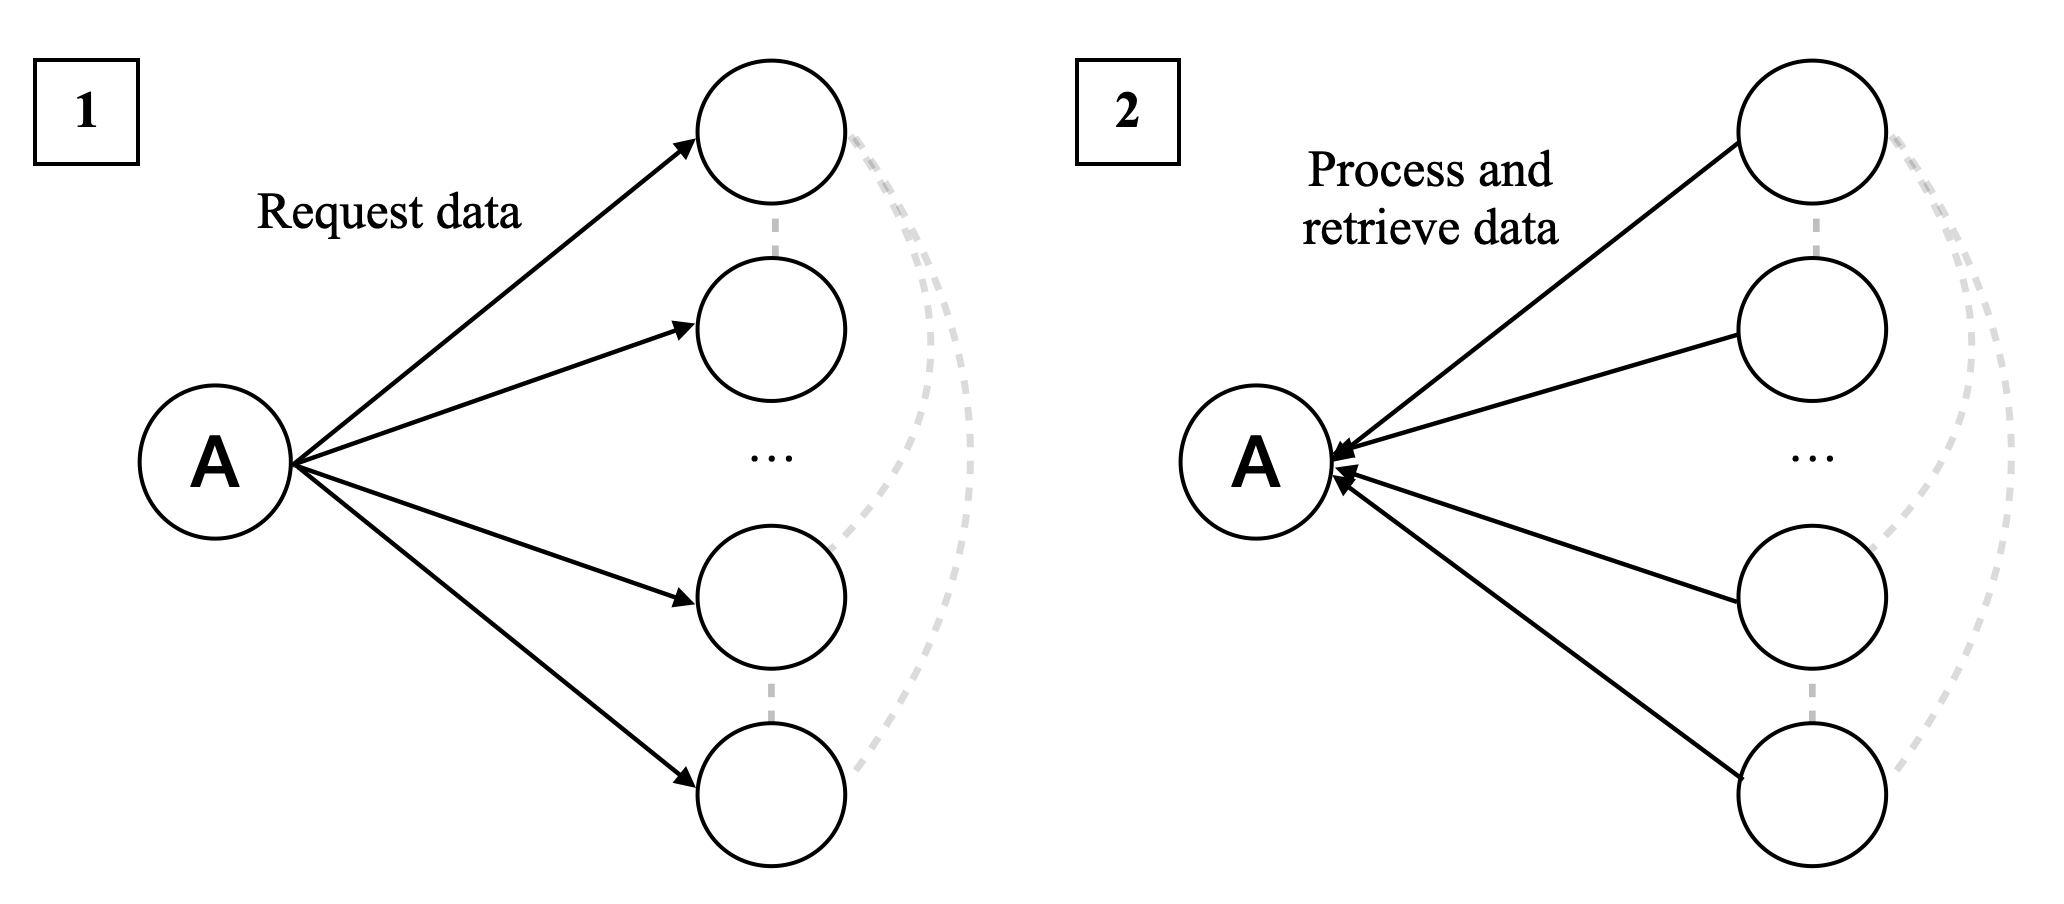
The image displays two distinct diagrams, labeled '1' and '2', illustrating a process involving a central entity 'A' and multiple other entities represented by circles. Diagram 1 depicts a "Request data" flow from 'A' to the other entities. Diagram 2 shows a "Process and retrieve data" flow, where data is returned to 'A' from the other entities. Both diagrams use a star-like topology originating from 'A'.
### Components/Axes
* **Central Entity:** Represented by a circle labeled 'A'. This entity is the origin of requests in diagram 1 and the destination of retrieved data in diagram 2.
* **External Entities:** Represented by multiple circles arranged vertically to the right of 'A'. The number of these entities is indicated by the presence of three visible circles and an ellipsis (...), suggesting a variable or larger number of entities.
* **Flow Arrows:** Solid black arrows indicate the direction of data flow.
* **Dashed Grey Arcs:** These arcs connect the external entities in a circular fashion, suggesting a potential relationship or communication channel between them, though no explicit label is provided for this connection.
* **Labels:**
* "1" (Top-left corner of the first diagram)
* "Request data" (Above the arrows originating from 'A' in diagram 1)
* "2" (Top-left corner of the second diagram)
* "Process and retrieve data" (Above the arrows originating from the external entities and pointing to 'A' in diagram 2)
### Detailed Analysis or Content Details
**Diagram 1: Request Data**
* **Description:** Entity 'A' initiates a request for data.
* **Flow:** Solid black arrows originate from 'A' and point towards each of the external entities.
* **Textual Annotation:** "Request data" is positioned above the outgoing arrows from 'A'.
* **Implied Action:** 'A' is sending out requests to multiple sources.
**Diagram 2: Process and Retrieve Data**
* **Description:** The external entities process the requests and return data to entity 'A'.
* **Flow:** Solid black arrows originate from the external entities and point towards 'A'.
* **Textual Annotation:** "Process and retrieve data" is positioned above the incoming arrows to 'A'.
* **Implied Action:** The external entities are performing an action (processing) and then sending data back to 'A'.
**Dashed Grey Arcs:**
* **Placement:** These arcs are positioned behind the external entities, curving from the top-most entity to the bottom-most entity in each diagram.
* **Interpretation:** While not explicitly labeled, these arcs suggest a potential network or communication path among the external entities themselves, or perhaps a cyclical dependency or grouping. They are present in both diagrams, indicating a consistent structural element.
### Key Observations
* The diagrams illustrate a two-phase process: an outbound request phase and an inbound retrieval phase.
* Entity 'A' acts as a central coordinator or consumer of data.
* The external entities are the providers of data, capable of processing requests.
* The ellipsis (...) indicates that the number of external entities is not fixed at three and could be more.
* The dashed grey arcs suggest an underlying structure or relationship among the external entities that is not directly part of the primary data flow from 'A'.
### Interpretation
These diagrams visually represent a common pattern in distributed systems, client-server architectures, or data retrieval mechanisms.
* **What the data suggests or demonstrates:** Diagram 1 demonstrates a broadcast or multicast request from a central entity ('A') to multiple data sources. Diagram 2 shows the subsequent response where these data sources fulfill the request, process the information, and return it to the central entity. This could represent a query to a database cluster, a request to microservices, or a task distribution scenario.
* **How the elements relate to each other:** Entity 'A' is the initiator and receiver. The external entities are the workers or data providers. The arrows clearly define the direction of information flow. The dashed arcs hint at a potential peer-to-peer communication or a shared context among the data providers, which might be relevant for coordination or data consistency, though this is not explicitly detailed.
* **Any notable outliers, trends, or anomalies:** There are no numerical data points or trends to analyze in this diagram. It is purely a conceptual representation of a process. The "..." is a standard notation to indicate continuation or an unspecified number of items, not an anomaly. The consistent presence of the dashed arcs in both diagrams suggests they are a stable feature of the system being depicted. The diagrams are simple and clear, lacking any complex interactions or unexpected elements.