\n
## Diagram: Data Request and Processing Flow
### Overview
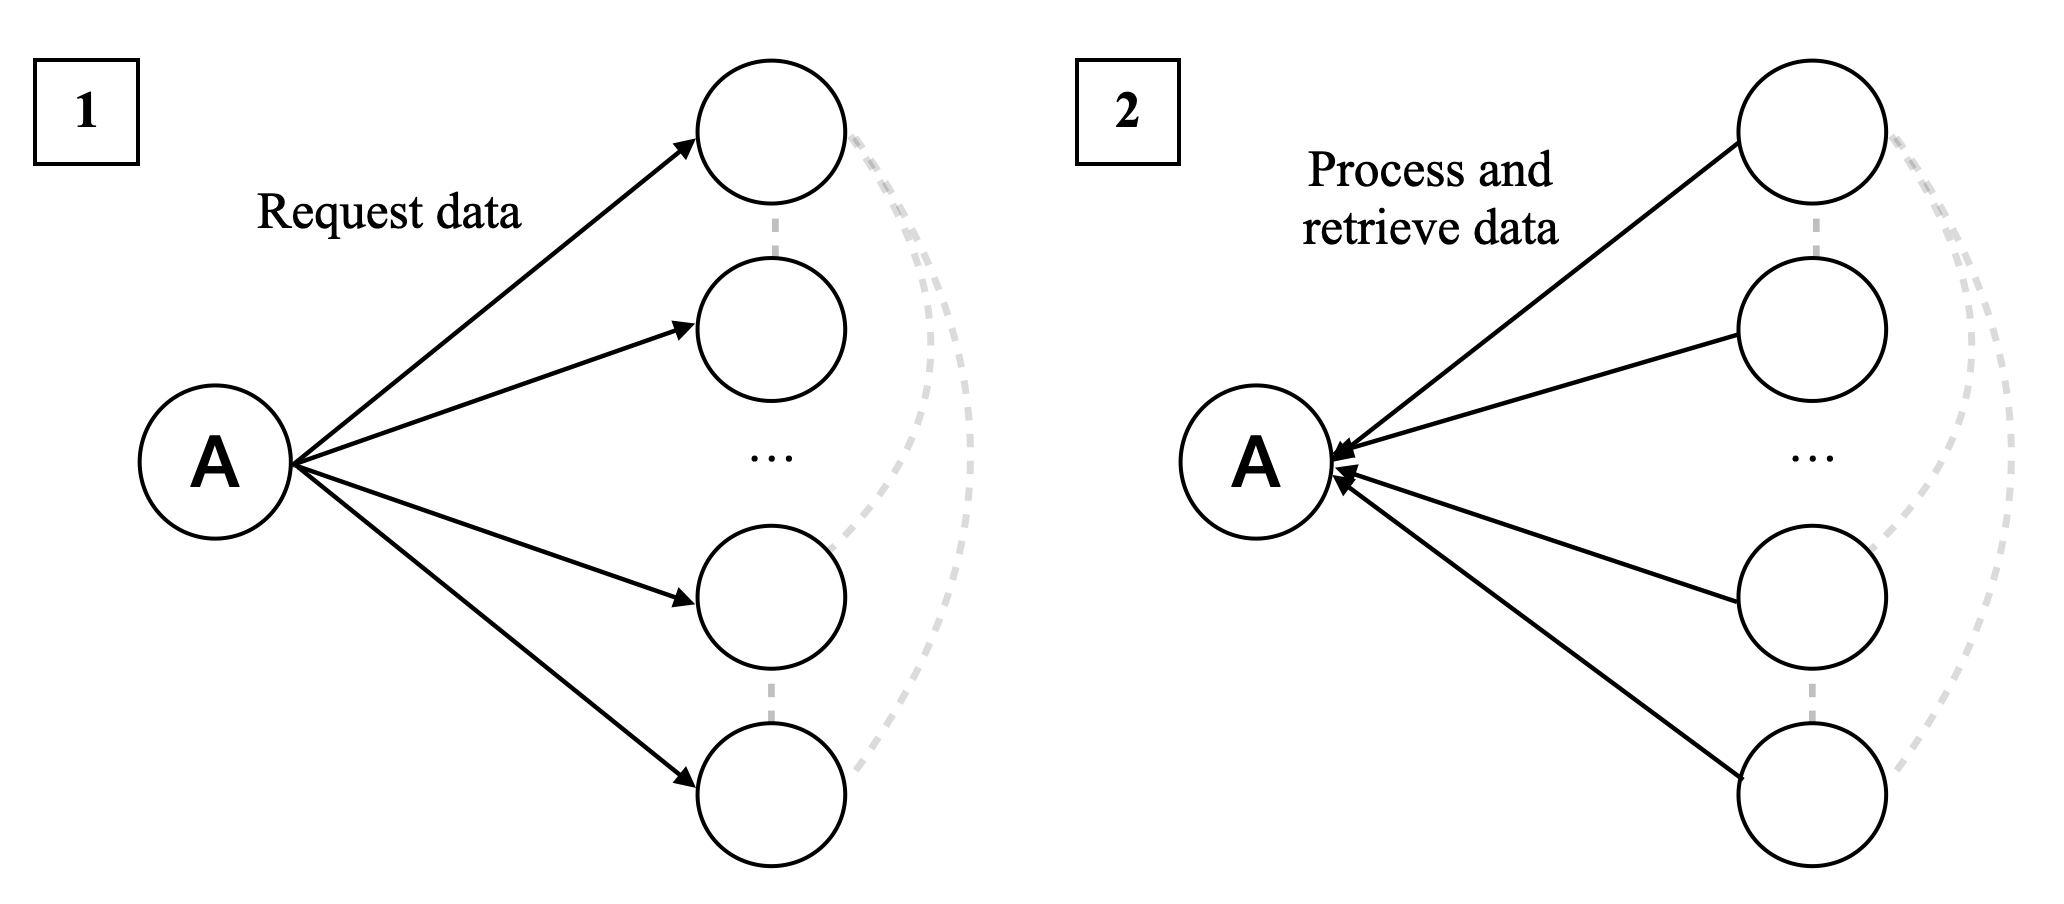
The image depicts a diagram illustrating a data request and processing flow. It shows a central node "A" interacting with multiple other nodes in two distinct stages: requesting data and processing/retrieving data. The diagram uses arrows to indicate the direction of data flow.
### Components/Axes
The diagram consists of the following components:
* **Node A:** A central node, labeled "A", depicted as a circle with a thicker border.
* **Data Nodes:** Multiple unlabeled circular nodes representing data sources or processing units.
* **Arrows:** Solid and dashed arrows indicating the direction of data flow.
* **Labels:** Two labels, "Request data" and "Process and retrieve data", describing the actions occurring in each stage.
* **Stage Indicators:** Boxes labeled "1" and "2" indicating the two stages of the process.
### Detailed Analysis or Content Details
The diagram is divided into two sections, labeled "1" and "2" in the top-left and top-right corners respectively.
**Section 1: Request Data**
* Node A (center-left) sends solid arrows to multiple data nodes.
* The label "Request data" is positioned along one of the arrows originating from Node A.
* The number of data nodes is indicated by "..." suggesting there are more nodes than are explicitly shown.
**Section 2: Process and Retrieve Data**
* Node A (center-right) sends dashed arrows to multiple data nodes.
* The label "Process and retrieve data" is positioned along one of the arrows originating from Node A.
* Similar to Section 1, "..." indicates that there are more data nodes than are shown.
### Key Observations
* The diagram illustrates a client-server or master-worker pattern. Node A acts as a central coordinator, requesting data from multiple sources and then processing/retrieving data from the same sources.
* The use of solid arrows for the request phase and dashed arrows for the processing/retrieval phase visually distinguishes the two stages.
* The "..." notation suggests scalability, implying that the system can handle a variable number of data nodes.
### Interpretation
The diagram represents a distributed data processing system. Node A initiates a request for data from multiple sources. After processing or retrieving the data, it receives the results back from the same sources. This could represent a data aggregation, query processing, or distributed computation scenario. The distinction between "request" and "process/retrieve" suggests a two-step interaction. The diagram doesn't provide specific details about the data being requested or the nature of the processing, but it clearly outlines the flow of information within the system. The use of dashed lines for the return path suggests a potentially asynchronous or less direct communication channel compared to the initial request. The diagram is a high-level conceptual representation and lacks quantitative data or specific implementation details.