## Diagram: Two-Phase Data Request and Retrieval Process
### Overview
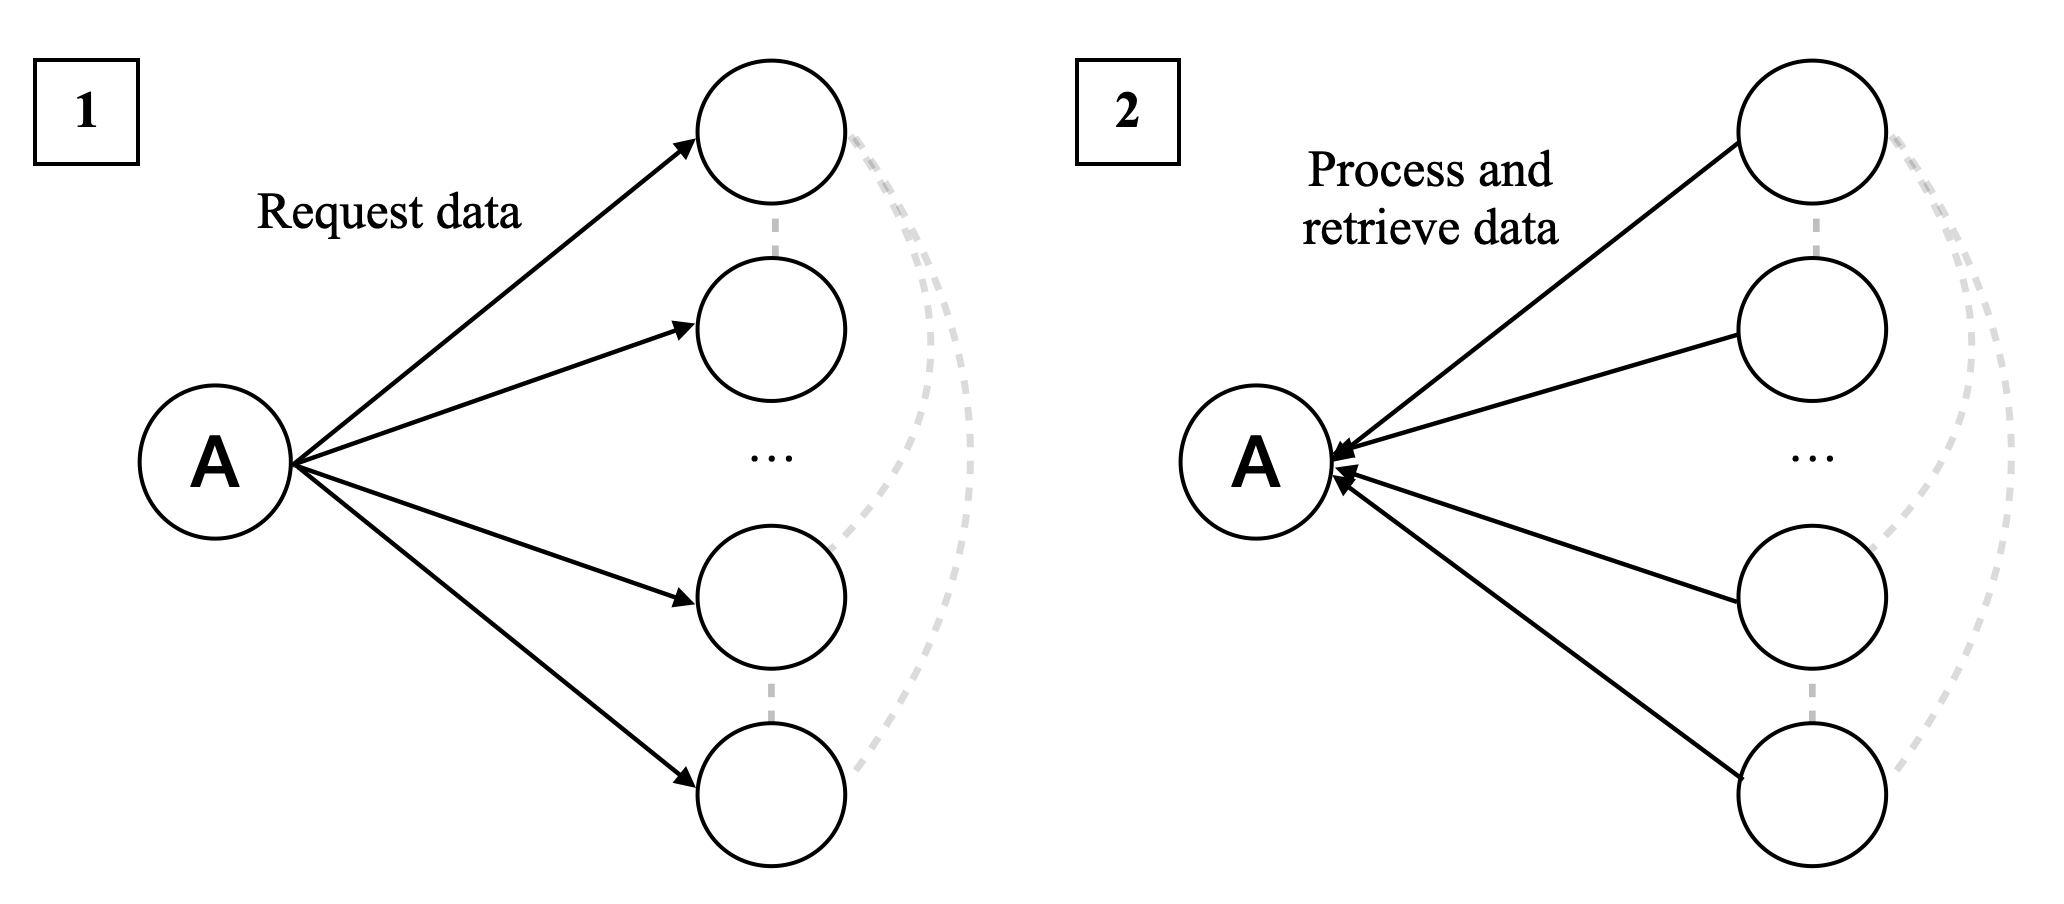
The image displays a two-panel technical diagram illustrating a sequential, two-phase communication or data flow process. The diagram is divided into two distinct sections, labeled "1" and "2" in the top-left corners of their respective panels. The process involves a central entity, labeled "A", interacting with a set of multiple, unlabeled peripheral entities. The flow of information or requests changes direction between the two phases.
### Components/Axes
* **Panel 1 (Left):**
* **Label:** A square box containing the number **"1"** is positioned in the top-left corner.
* **Central Node:** A circle labeled with the capital letter **"A"**.
* **Peripheral Nodes:** Four circles are arranged vertically to the right of node "A". An ellipsis **"..."** is placed between the second and third circles, indicating an indefinite number of additional nodes in this group.
* **Connections:** Four solid black arrows originate from node "A" and point towards each of the visible peripheral nodes.
* **Descriptive Text:** The phrase **"Request data"** is positioned above the arrows, describing the action of this phase.
* **Grouping Indicator:** A dashed, light-gray line connects the peripheral nodes vertically on their right side, suggesting they belong to a common group or cluster.
* **Panel 2 (Right):**
* **Label:** A square box containing the number **"2"** is positioned in the top-left corner.
* **Central Node:** A circle labeled with the capital letter **"A"**, identical to the one in Panel 1.
* **Peripheral Nodes:** The same arrangement of four circles and an ellipsis **"..."** as seen in Panel 1.
* **Connections:** Four solid black arrows originate from the peripheral nodes and point towards the central node "A".
* **Descriptive Text:** The phrase **"Process and retrieve data"** is positioned above the arrows, describing the action of this phase.
* **Grouping Indicator:** The same dashed, light-gray line connects the peripheral nodes vertically on their right side.
### Detailed Analysis
The diagram depicts a clear, two-step sequence:
1. **Phase 1 (Request):** The central actor "A" initiates communication by sending requests outward to multiple, distinct entities. The arrow direction (from "A" to the group) and the label "Request data" confirm this is a one-to-many broadcast or multicast request.
2. **Phase 2 (Response/Processing):** The flow reverses. The multiple entities now send information back to the central actor "A". The arrow direction (from the group to "A") and the label "Process and retrieve data" indicate this is a many-to-one aggregation, processing, or response phase.
The consistent use of the same node labels ("A" and the unlabeled circles) and the dashed grouping line across both panels confirms that the same set of actors is involved in both phases of the process. The ellipsis is a critical component, explicitly stating that the diagram is a simplified representation and the system can scale to include more than the four peripheral nodes shown.
### Key Observations
* **Symmetry and Reversal:** The diagram's primary visual feature is the symmetrical reversal of arrow direction between the two panels, highlighting the request-response nature of the process.
* **Centralized Architecture:** The topology is a classic star network, with "A" as the central hub and the other nodes as spokes. This implies a centralized control or coordination point.
* **Abstraction:** The peripheral nodes are intentionally left unlabeled, making the diagram a generic model applicable to various scenarios (e.g., client-server, master-worker, aggregator-services).
* **Sequential Phasing:** The numbered labels ("1" and "2") enforce a strict temporal order: the request phase must precede the processing/retrieval phase.
### Interpretation
This diagram is a fundamental model for a **synchronous or asynchronous distributed data retrieval pattern**. It visually answers the question: "How does a central component gather data from multiple sources?"
* **What it demonstrates:** It illustrates the decoupling of the *request initiation* from the *data processing/aggregation*. Phase 1 is about task distribution or query broadcasting. Phase 2 is about result collection and synthesis.
* **Relationships:** The relationship is hierarchical and transactional. "A" is the orchestrator or client, while the peripheral nodes are workers, services, or data sources. The dashed line suggests the peripheral nodes may be peers or part of a unified system (like a database shard cluster or a microservice fleet) from the perspective of "A".
* **Notable Implications:** The model implies potential latency considerations—the total time for the process is at least the sum of the time for the slowest request (Phase 1) and the slowest response (Phase 2). It also suggests the need for "A" to manage multiple concurrent connections and to handle partial failures if some peripheral nodes do not respond. The "Process and retrieve data" label in Phase 2 is key; it indicates that the peripheral nodes are not merely returning raw data but may be performing computation, filtering, or formatting before sending the result back.