## Diagram: Two-Step Data Flow Process
### Overview
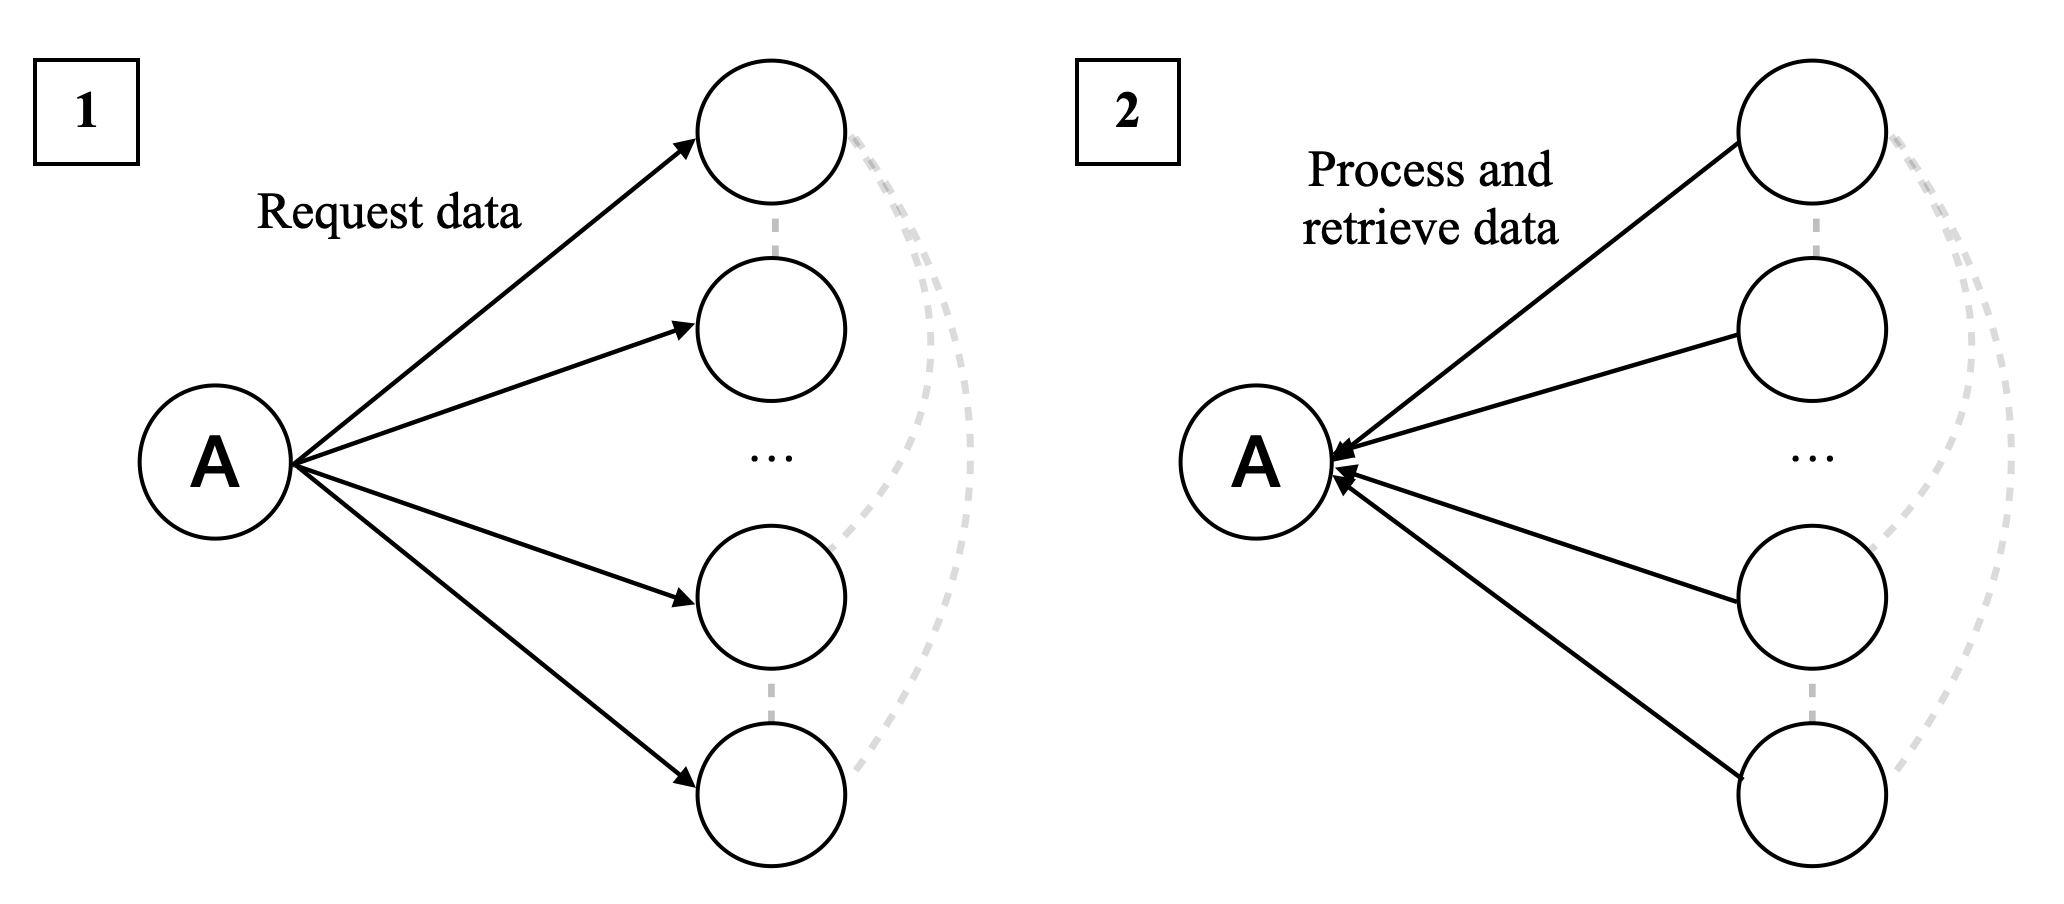
The image depicts a two-stage data flow process represented as a diagram with labeled sections. Section 1 ("Request data") and Section 2 ("Process and retrieve data") illustrate interactions between a central node labeled "A" and multiple peripheral nodes. Arrows indicate directional relationships, with solid lines in Section 1 and dashed lines in Section 2. Dotted lines connect nodes in both sections, suggesting indirect or secondary relationships.
### Components/Axes
- **Nodes**:
- Central node labeled "A" (appears in both sections).
- Multiple unlabeled peripheral nodes (represented as empty circles) connected to "A."
- **Arrows**:
- **Section 1 (Request data)**: Solid arrows from "A" to peripheral nodes, indicating data requests.
- **Section 2 (Process and retrieve data)**: Dashed arrows from "A" to peripheral nodes, suggesting data processing/retrieval.
- **Dotted Lines**: Connect peripheral nodes in both sections, possibly representing dependencies or indirect interactions.
### Detailed Analysis
- **Section 1 (Request data)**:
- Node "A" initiates requests to peripheral nodes via solid arrows.
- Peripheral nodes are arranged in a linear sequence (left to right) with no explicit labels.
- Dotted lines between peripheral nodes may imply shared dependencies or parallel processing.
- **Section 2 (Process and retrieve data)**:
- Node "A" processes data from peripheral nodes via dashed arrows.
- Peripheral nodes are similarly arranged but connected via dashed lines, indicating a return or feedback loop.
- Dotted lines persist, suggesting ongoing indirect relationships.
### Key Observations
1. **Directional Flow**: Solid arrows in Section 1 emphasize unidirectional data requests, while dashed arrows in Section 2 suggest bidirectional or iterative processing.
2. **Node "A"**: Acts as the central hub for both initiating and resolving data interactions.
3. **Dotted Lines**: Persist across both sections, hinting at a networked or modular system architecture.
4. **No Numerical Data**: The diagram focuses on structural relationships rather than quantitative metrics.
### Interpretation
This diagram likely represents a system workflow where node "A" (e.g., a server, application, or central processor) coordinates data requests and subsequent processing. The transition from solid to dashed arrows in Section 2 implies a shift from initial data acquisition to analysis or retrieval. The dotted lines suggest that peripheral nodes may interact indirectly (e.g., through shared resources or secondary systems).
The absence of labels on peripheral nodes limits specificity but emphasizes their role as generic components in the process. The diagram could model scenarios such as:
- A client-server architecture where "A" requests data from multiple servers (Section 1) and aggregates/processes results (Section 2).
- A distributed computing system where "A" orchestrates tasks across nodes.
- A data pipeline with feedback loops for iterative refinement.
The use of dashed arrows in Section 2 may indicate asynchronous operations, error handling, or data validation steps. Overall, the diagram highlights modularity, central coordination, and bidirectional data flow in a technical system.