## Line Chart: SecAlign and StruQ Output Probabilities
### Overview
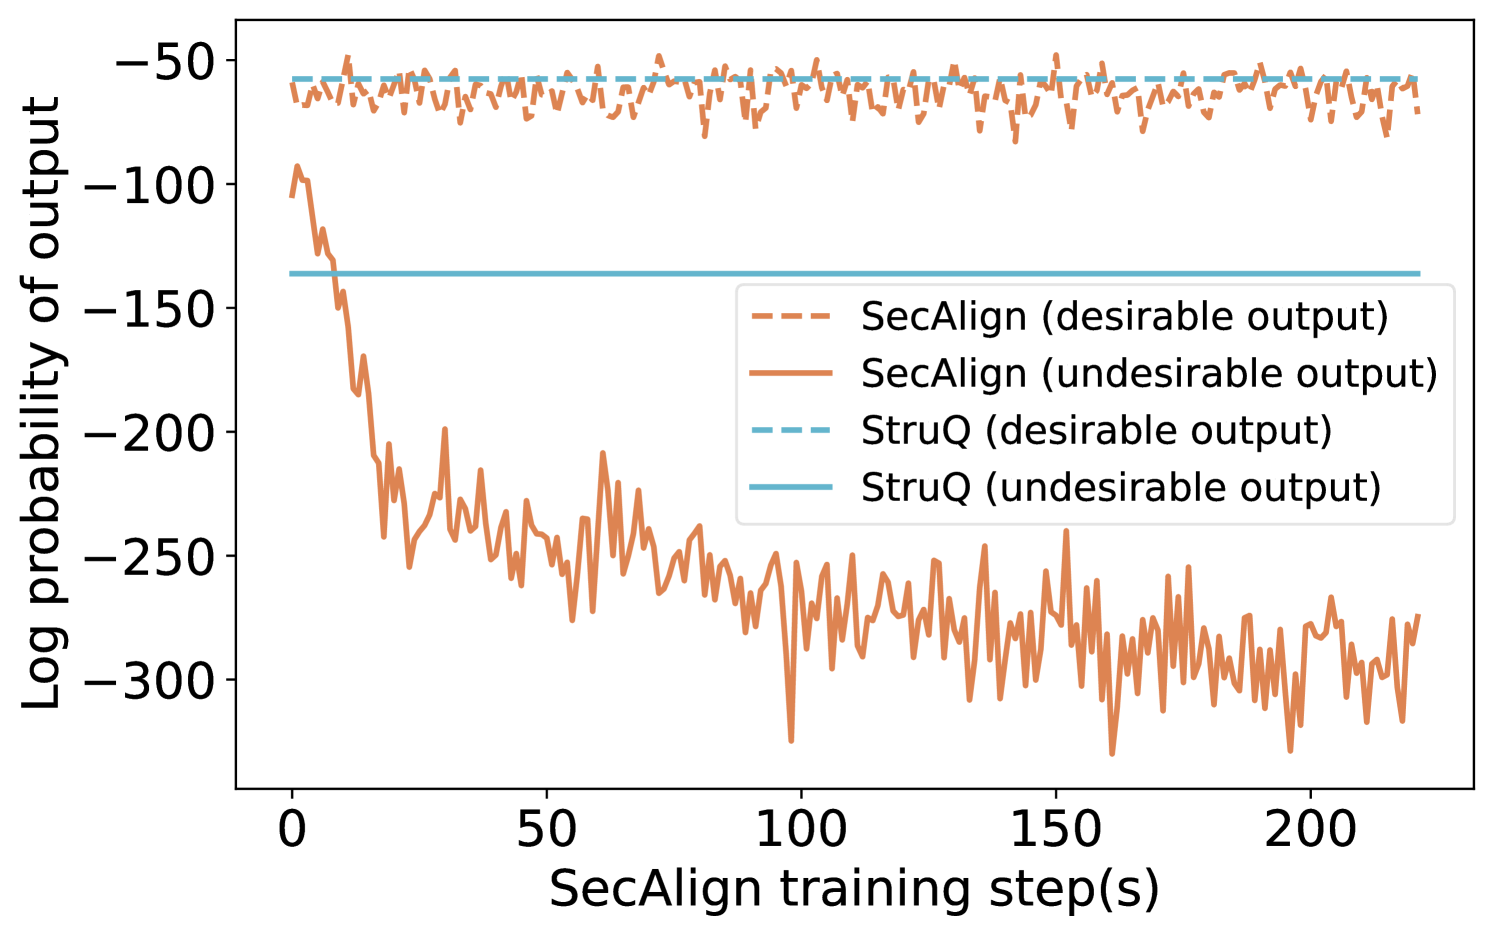
The image is a line chart comparing the log probability of output for two models, SecAlign and StruQ, during training. Each model has a line representing both desirable and undesirable outputs. The x-axis represents the SecAlign training step in seconds, and the y-axis represents the log probability of the output.
### Components/Axes
* **X-axis:** "SecAlign training step(s)". The scale ranges from 0 to 200, with tick marks at intervals of 50.
* **Y-axis:** "Log probability of output". The scale ranges from -300 to -50, with tick marks at intervals of 50.
* **Legend:** Located in the center-right of the chart, it identifies the lines:
* Dashed light-brown line: "SecAlign (desirable output)"
* Solid brown line: "SecAlign (undesirable output)"
* Dashed light-blue line: "StruQ (desirable output)"
* Solid light-blue line: "StruQ (undesirable output)"
### Detailed Analysis
* **SecAlign (desirable output):** The dashed light-brown line fluctuates around -60. The values appear to range between approximately -50 and -70.
* **SecAlign (undesirable output):** The solid brown line starts around -100 and decreases rapidly to approximately -250 by step 50. It then fluctuates between -220 and -300 for the remainder of the training steps.
* **StruQ (desirable output):** The dashed light-blue line is relatively stable around -60. The values appear to range between approximately -55 and -65.
* **StruQ (undesirable output):** The solid light-blue line is stable at approximately -140.
### Key Observations
* The "desirable output" probabilities for both SecAlign and StruQ are relatively stable throughout the training process.
* The "undesirable output" probability for SecAlign decreases significantly during the first 50 training steps before stabilizing at a lower level.
* The "undesirable output" probability for StruQ remains constant throughout the training process.
### Interpretation
The chart illustrates the training performance of SecAlign and StruQ models, showing how the log probabilities of desirable and undesirable outputs change over time. The significant drop in the undesirable output probability for SecAlign suggests that the model learns to differentiate between desirable and undesirable outputs during training. In contrast, StruQ's undesirable output probability remains constant, indicating that it may not be learning to distinguish between the two types of outputs as effectively. The stable desirable output probabilities for both models suggest that they consistently produce desirable outputs throughout the training process.