\n
## Line Chart: Log Probability of Output vs. Training Step
### Overview
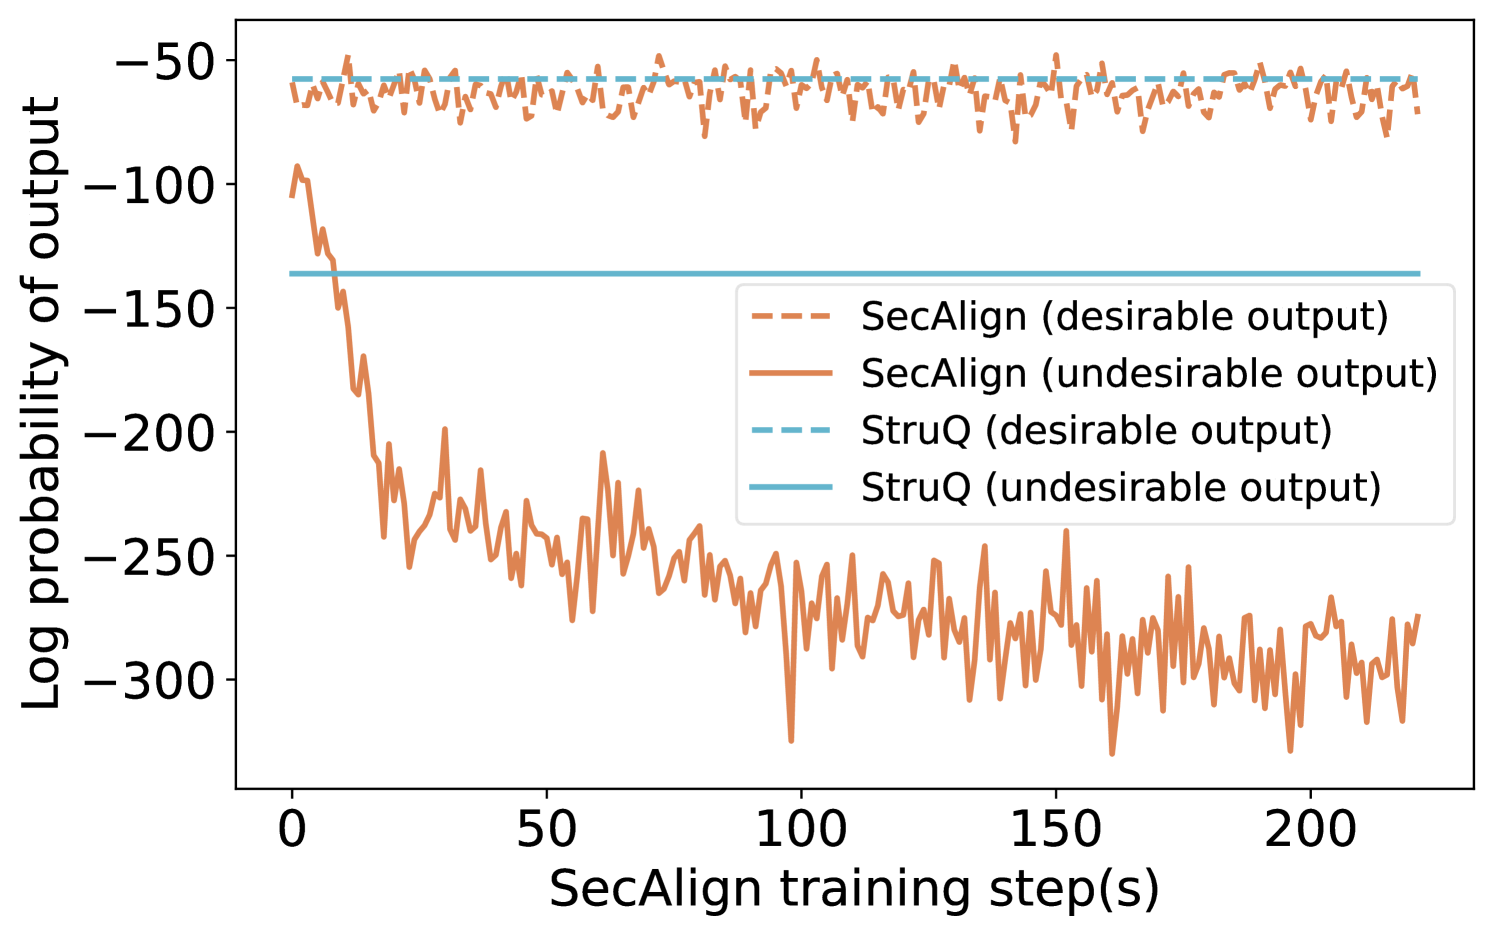
This chart displays the log probability of output for two models, SecAlign and StruQ, during training. Each model has two lines representing "desirable" and "undesirable" outputs, plotted against the SecAlign training step. The chart aims to visualize how the models' performance evolves over training iterations, distinguishing between preferred and non-preferred outcomes.
### Components/Axes
* **X-axis:** SecAlign training step(s), ranging from approximately 0 to 220.
* **Y-axis:** Log probability of output, ranging from approximately -320 to -40.
* **Legend:** Located in the top-right corner, containing the following labels and corresponding line styles/colors:
* SecAlign (desirable output) - Orange dashed line
* SecAlign (undesirable output) - Orange solid line
* StruQ (desirable output) - Blue dashed line
* StruQ (undesirable output) - Blue solid line
### Detailed Analysis
The chart presents four distinct lines, each representing a different training scenario.
* **SecAlign (desirable output):** The orange dashed line starts at approximately -60 and remains relatively stable throughout the training process, fluctuating between approximately -65 and -45. It shows minimal downward trend.
* **SecAlign (undesirable output):** The orange solid line begins at approximately -120 and rapidly decreases to around -280 within the first 20 training steps. It then fluctuates significantly, remaining generally between -250 and -320 for the remainder of the training period.
* **StruQ (desirable output):** The blue dashed line starts at approximately -80 and exhibits a slight downward trend, stabilizing around -100 to -110 after approximately 50 training steps. It remains relatively stable for the rest of the training.
* **StruQ (undesirable output):** The blue solid line starts at approximately -180 and rapidly decreases to around -290 within the first 20 training steps. It then fluctuates significantly, remaining generally between -260 and -320 for the remainder of the training period.
### Key Observations
* Both models exhibit a clear distinction between desirable and undesirable outputs. The desirable outputs (dashed lines) consistently have higher log probabilities than the undesirable outputs (solid lines).
* The initial training steps show a significant drop in log probability for the undesirable outputs of both models, suggesting a rapid learning phase where the models begin to differentiate between good and bad outcomes.
* The SecAlign desirable output line is consistently higher than the StruQ desirable output line.
* The undesirable outputs of both models converge to a similar range of log probabilities after the initial drop.
### Interpretation
The chart demonstrates that both SecAlign and StruQ models are capable of learning to distinguish between desirable and undesirable outputs during training. The rapid initial decrease in log probability for the undesirable outputs suggests that the models quickly identify and penalize suboptimal outcomes. The relatively stable log probabilities for the desirable outputs indicate that the models maintain a consistent level of performance on preferred tasks.
The difference in the initial log probabilities and the overall levels of the desirable output lines between SecAlign and StruQ suggests that SecAlign may be performing better overall than StruQ, or that the definition of "desirable" is different between the two models. The convergence of the undesirable outputs suggests that both models eventually reach a similar level of performance on less-preferred tasks.
The chart provides valuable insights into the training dynamics of these models, highlighting their ability to learn and differentiate between different types of outputs. Further analysis could involve investigating the specific characteristics of the desirable and undesirable outputs to understand why the models prefer certain outcomes over others.