## Line Chart: Log Probability of Output vs. SecAlign Training Steps
### Overview
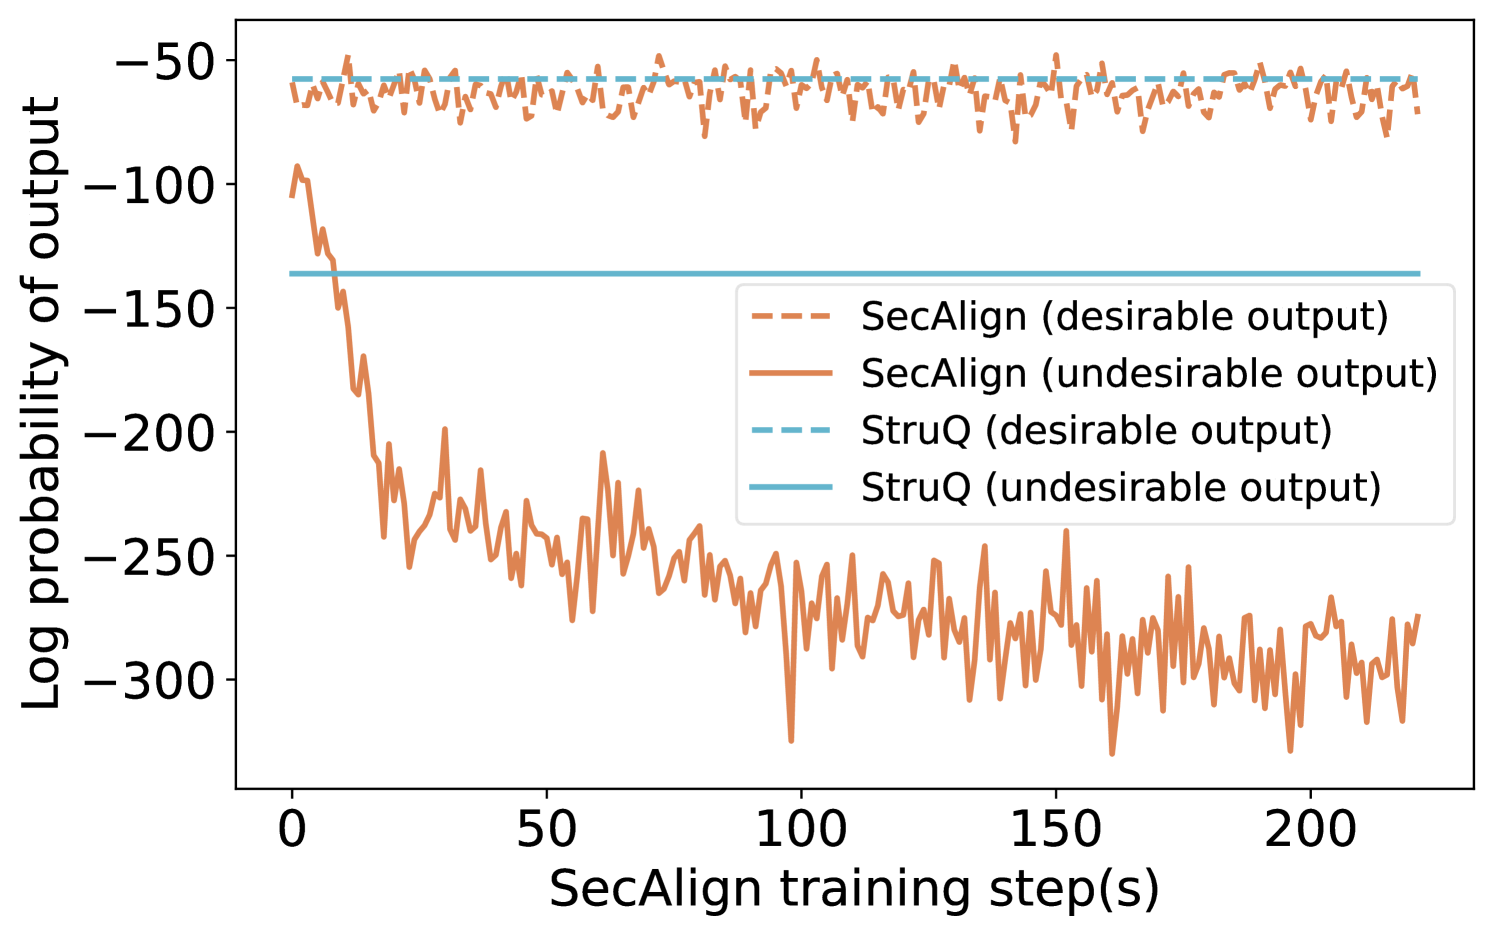
This image is a line chart comparing the performance of two methods, "SecAlign" and "StruQ," over the course of training. It plots the log probability of model outputs (y-axis) against the number of SecAlign training steps (x-axis). The chart tracks two types of outputs for each method: "desirable" and "undesirable."
### Components/Axes
* **X-Axis:** Labeled "SecAlign training step(s)". The scale runs from 0 to approximately 220, with major tick marks at 0, 50, 100, 150, and 200.
* **Y-Axis:** Labeled "Log probability of output". The scale is negative, running from -300 at the bottom to -50 at the top, with major tick marks at -300, -250, -200, -150, -100, and -50.
* **Legend:** Positioned in the center-right of the chart area. It defines four data series:
* `--- SecAlign (desirable output)`: Dashed orange line.
* `— SecAlign (undesirable output)`: Solid orange line.
* `--- StruQ (desirable output)`: Dashed light blue line.
* `— StruQ (undesirable output)`: Solid light blue line.
### Detailed Analysis
1. **SecAlign (desirable output) - Dashed Orange Line:**
* **Trend:** The line shows high-frequency, low-amplitude noise but remains relatively stable horizontally across all training steps.
* **Values:** It fluctuates within a narrow band, approximately between -55 and -75 on the log probability scale.
2. **SecAlign (undesirable output) - Solid Orange Line:**
* **Trend:** This line exhibits a dramatic, steep downward slope at the beginning of training (steps 0-25), followed by a continued, noisier decline that gradually flattens but remains volatile.
* **Values:** It starts near -100 at step 0. By step 25, it has dropped to approximately -200. It continues to fall, reaching a range between -250 and -300 from step 100 onward, with frequent spikes and dips.
3. **StruQ (desirable output) - Dashed Light Blue Line:**
* **Trend:** This is a perfectly horizontal, flat line.
* **Values:** It is constant at approximately -55 across the entire x-axis.
4. **StruQ (undesirable output) - Solid Light Blue Line:**
* **Trend:** This is also a perfectly horizontal, flat line.
* **Values:** It is constant at approximately -140 across the entire x-axis.
### Key Observations
* **SecAlign Dynamics:** There is a massive and growing divergence between the log probability of desirable and undesirable outputs for the SecAlign method as training progresses. The probability of undesirable outputs plummets.
* **StruQ Stability:** Both StruQ metrics (desirable and undesirable) are completely static, showing no change with SecAlign training steps.
* **Performance Gap:** At the start (step 0), the undesirable output probability for SecAlign (~-100) is higher (less negative) than that of StruQ (~-140). By the end of the plotted training (step ~220), SecAlign's undesirable probability (~-280) is significantly lower (more negative) than StruQ's fixed value.
* **Desirable Output Parity:** The desirable output probabilities for both methods are in a similar range (SecAlign ~-65, StruQ ~-55), with StruQ being slightly higher (less negative).
### Interpretation
This chart demonstrates the core objective and effect of the SecAlign training process. The data suggests that SecAlign is an active training procedure designed to **selectively suppress the model's tendency to produce undesirable outputs** while maintaining (or slightly reducing) the probability of desirable ones.
* **Mechanism:** The steep initial drop in the solid orange line indicates that SecAlign rapidly learns to penalize undesirable outputs. The continued noisy decline suggests ongoing refinement.
* **Contrast with Baseline:** StruQ appears to be a static baseline or a different method whose output probabilities are not affected by SecAlign training steps. The flat lines serve as a control, showing what the probabilities would be without this specific training intervention.
* **Effectiveness:** The widening gap between the two SecAlign lines is the key result. It visually confirms that the training is successfully creating a distinction in the model's internal scoring between "good" and "bad" responses, making undesirable outputs far less likely (as measured by log probability). The fact that the desirable output line for SecAlign remains stable (dashed orange) is crucial, as it indicates the training is not broadly degrading model performance but is targeted.
* **Implication:** For a technical document, this chart provides strong evidence that SecAlign training effectively aligns model behavior by drastically reducing the likelihood of undesirable outputs over time, outperforming the static StruQ baseline on this specific metric by the end of training.