## Probabilistic Graphical Model: Generative Process for Observations
### Overview
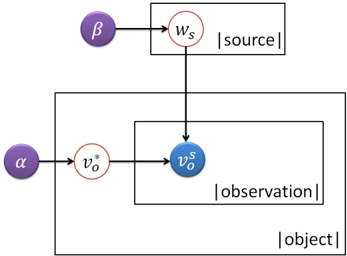
The image displays a Probabilistic Graphical Model (PGM) using plate notation. This diagram illustrates a generative process where an observed variable ($v_o^s$) is conditioned on two latent variables: a source-specific parameter ($w_s$) and an object-specific parameter ($v_o^*$). The model uses nested plates to denote the repetition of variables across different sources, objects, and observations.
### Components/Axes
The diagram consists of nodes (circles) and plates (rectangles) connected by directed edges (arrows).
**Nodes:**
* **Purple Circles (Hyperparameters/Constants):**
* $\alpha$: Located on the far left, middle-height.
* $\beta$: Located on the far left, top-height.
* **White Circles with Red Borders (Latent Variables):**
* $w_s$: Located in the top-right region, inside the $|source|$ plate.
* $v_o^*$: Located in the middle-left region, inside the $|object|$ plate.
* **Blue Circle (Observed Variable):**
* $v_o^s$: Located in the center of the diagram, inside the $|observation|$ plate.
**Plates (Rectangles):**
* **$|source|$:** A rectangle in the top-right, enclosing the node $w_s$.
* **$|object|$:** A large rectangle encompassing the bottom two-thirds of the diagram, enclosing the node $v_o^*$ and the $|observation|$ plate.
* **$|observation|$:** A rectangle in the center, nested within the $|object|$ plate, enclosing the node $v_o^s$.
### Detailed Analysis
The diagram defines the conditional dependencies between the variables through directed edges:
1. **Source Branch (Top):**
* The hyperparameter $\beta$ (purple) points to the latent variable $w_s$ (white/red).
* The variable $w_s$ then points downward to the observed variable $v_o^s$.
2. **Object Branch (Bottom):**
* The hyperparameter $\alpha$ (purple) points to the latent variable $v_o^*$ (white/red).
* The variable $v_o^*$ points to the right, toward the observed variable $v_o^s$.
3. **Convergence:**
* The observed variable $v_o^s$ (blue) acts as the child node for both $w_s$ and $v_o^*$.
**Spatial Positioning:**
* **Top-Left:** $\beta$
* **Top-Right:** $|source|$ plate containing $w_s$.
* **Middle-Left:** $\alpha$ and $v_o^*$.
* **Center:** $|observation|$ plate containing $v_o^s$.
* **Bottom:** The $|object|$ plate acts as the container for the object-specific logic.
### Key Observations
* **Conditional Independence:** The observed variable $v_o^s$ is conditionally dependent on both the source parameter ($w_s$) and the object parameter ($v_o^*$).
* **Hierarchical Structure:** The nesting of the $|observation|$ plate inside the $|object|$ plate indicates that for every object, there are multiple observations.
* **Variable Types:** The color coding distinguishes between fixed hyperparameters (purple), latent variables (white/red), and observed data (blue).
* **Flow:** The diagram represents a generative process where the source and object characteristics are combined to produce an observation.
### Interpretation
This diagram represents a standard Bayesian generative model, likely used in fields like computer vision, natural language processing, or recommendation systems.
* **The Logic:** The model posits that an observation ($v_o^s$) is not independent; it is the result of a specific source (e.g., a specific camera, a specific writer, or a specific user) and a specific object (e.g., a specific item, a specific word, or a specific entity).
* **The "Why":** By separating the source influence ($w_s$) from the object influence ($v_o^*$), the model allows for the disentanglement of factors. For example, if $v_o^s$ is an image of an object, $w_s$ might represent the lighting conditions or camera style (source), while $v_o^*$ represents the intrinsic properties of the object itself.
* **Peircean Investigative View:** The model suggests that to understand the observation ($v_o^s$), one must account for the context of the source and the identity of the object. The hyperparameters $\alpha$ and $\beta$ act as the "prior" knowledge or constraints on these latent factors, effectively regularizing the model to prevent overfitting to specific sources or objects.