## Charts: Scaling Relationships of N, D, and D/N with C
### Overview
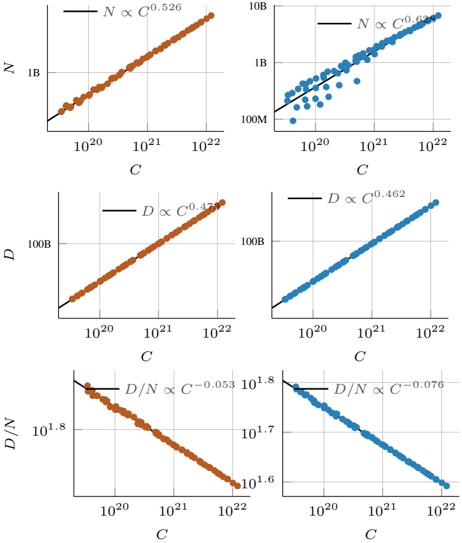
The image presents three scatter plots arranged in a 3x2 grid, displaying scaling relationships between different variables (N, D, and D/N) and a variable 'C'. Each plot includes data points and a fitted line, along with a power-law relationship equation. The plots are grayscale.
### Components/Axes
Each plot shares the following characteristics:
* **X-axis:** Labeled 'C', with a logarithmic scale ranging from approximately 10<sup>20</sup> to 10<sup>22</sup>.
* **Y-axis:** Each plot has a different Y-axis label and scale:
* Top-left: 'N', logarithmic scale from approximately 10<sup>0</sup> to 10<sup>10</sup> (labeled as 1B and 10B).
* Top-right: 'N', logarithmic scale from approximately 10<sup>8</sup> to 10<sup>10</sup> (labeled as 100M and 1B).
* Middle-left: 'D', logarithmic scale from approximately 10<sup>8</sup> to 10<sup>10</sup> (labeled as 100B).
* Middle-right: 'D', logarithmic scale from approximately 10<sup>8</sup> to 10<sup>10</sup> (labeled as 100B).
* Bottom-left: 'D/N', logarithmic scale from approximately 10<sup>-9</sup> to 10<sup>-6</sup> (labeled as 10<sup>-8</sup> and 10<sup>-6</sup>).
* Bottom-right: 'D/N', logarithmic scale from approximately 10<sup>-9</sup> to 10<sup>-6</sup> (labeled as 10<sup>-8</sup> and 10<sup>-6</sup>).
* **Data Points:** Each plot contains numerous data points, colored either orange or blue.
* **Fitted Lines:** A solid line is fitted through each set of data points, also colored orange or blue.
* **Equations:** Each plot displays an equation of the form "Variable ∝ C<sup>exponent</sup>" above the plot.
### Detailed Analysis or Content Details
**Top-Left Plot (N vs. C):**
* Color: Orange
* Trend: The data points exhibit an upward trend, indicating a positive correlation between N and C. The line slopes upward.
* Equation: N ∝ C<sup>0.526</sup>
* Data Points (approximate):
* C = 10<sup>20</sup>, N ≈ 10<sup>0</sup>
* C = 10<sup>21</sup>, N ≈ 10<sup>5</sup>
* C = 10<sup>22</sup>, N ≈ 10<sup>10</sup>
**Top-Right Plot (N vs. C):**
* Color: Blue
* Trend: The data points exhibit an upward trend, indicating a positive correlation between N and C. The line slopes upward.
* Equation: N ∝ C<sup>0.694</sup>
* Data Points (approximate):
* C = 10<sup>20</sup>, N ≈ 10<sup>8</sup>
* C = 10<sup>21</sup>, N ≈ 10<sup>9</sup>
* C = 10<sup>22</sup>, N ≈ 10<sup>10</sup>
**Middle-Left Plot (D vs. C):**
* Color: Orange
* Trend: The data points exhibit an upward trend, indicating a positive correlation between D and C. The line slopes upward.
* Equation: D ∝ C<sup>0.429</sup>
* Data Points (approximate):
* C = 10<sup>20</sup>, D ≈ 10<sup>8</sup>
* C = 10<sup>21</sup>, D ≈ 10<sup>9</sup>
* C = 10<sup>22</sup>, D ≈ 10<sup>10</sup>
**Middle-Right Plot (D vs. C):**
* Color: Blue
* Trend: The data points exhibit an upward trend, indicating a positive correlation between D and C. The line slopes upward.
* Equation: D ∝ C<sup>0.462</sup>
* Data Points (approximate):
* C = 10<sup>20</sup>, D ≈ 10<sup>8</sup>
* C = 10<sup>21</sup>, D ≈ 10<sup>9</sup>
* C = 10<sup>22</sup>, D ≈ 10<sup>10</sup>
**Bottom-Left Plot (D/N vs. C):**
* Color: Orange
* Trend: The data points exhibit a downward trend, indicating a negative correlation between D/N and C. The line slopes downward.
* Equation: D/N ∝ C<sup>-0.053</sup>
* Data Points (approximate):
* C = 10<sup>20</sup>, D/N ≈ 10<sup>-8</sup>
* C = 10<sup>21</sup>, D/N ≈ 10<sup>-7</sup>
* C = 10<sup>22</sup>, D/N ≈ 10<sup>-6</sup>
**Bottom-Right Plot (D/N vs. C):**
* Color: Blue
* Trend: The data points exhibit a downward trend, indicating a negative correlation between D/N and C. The line slopes downward.
* Equation: D/N ∝ C<sup>-0.076</sup>
* Data Points (approximate):
* C = 10<sup>20</sup>, D/N ≈ 10<sup>-8</sup>
* C = 10<sup>21</sup>, D/N ≈ 10<sup>-7</sup>
* C = 10<sup>22</sup>, D/N ≈ 10<sup>-6</sup>
### Key Observations
* Both datasets (orange and blue) show positive correlations between N and C, and between D and C.
* Both datasets show negative correlations between D/N and C.
* The exponents in the power-law relationships differ slightly between the two datasets, suggesting different scaling behaviors.
* The scaling exponent for N is larger than that for D in both datasets.
### Interpretation
The plots demonstrate power-law scaling relationships between the variables N, D, and D/N with respect to C. The positive scaling of N and D with C suggests that as C increases, both N and D tend to increase as well. The negative scaling of D/N with C indicates that the ratio of D to N decreases as C increases. The differing exponents between the orange and blue datasets suggest that the underlying systems or processes generating these relationships are not identical. The fact that N scales more strongly with C than D suggests that N is more sensitive to changes in C than D. These relationships could be indicative of complex system behavior, such as self-organized criticality or fractal growth. The specific meaning of N, D, and C would require additional context to fully interpret.