## Line Graphs: Unlabeled Time Series Data
### Overview
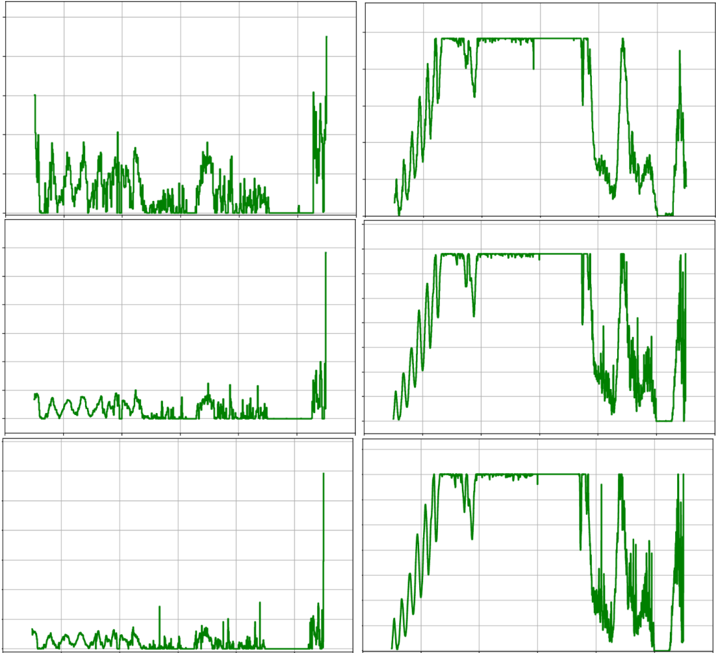
The image contains six unlabeled line graphs arranged in a 2x3 grid (two columns, three rows). Each graph features a single green line on a white background with grid lines. No axis labels, legends, or textual annotations are visible. The graphs exhibit varying degrees of volatility, with distinct patterns in amplitude and frequency across the series.
### Components/Axes
- **Axes**: No axis titles, labels, or scales are present. Grid lines suggest a Cartesian coordinate system, but units or timeframes are unspecified.
- **Legend**: Absent. No color-coded data series identifiers are provided.
- **Grid**: Uniform light gray grid lines divide each graph into equal rectangular cells.
### Detailed Analysis
1. **Top-Left Graph**:
- The green line exhibits high-frequency oscillations with irregular amplitude.
- A sharp upward spike occurs near the right edge, reaching approximately 20% of the vertical axis range.
- No discernible trend; data appears noisy.
2. **Top-Right Graph**:
- The line shows a gradual decline followed by a plateau (horizontal segment) near the top.
- A secondary dip occurs midway, followed by a recovery.
- Overall trend: Decreasing then stabilizing.
3. **Middle-Left Graph**:
- Similar to the top-left graph but with reduced amplitude in oscillations.
- A pronounced spike near the right edge, slightly less steep than the top-left graph.
- No clear trend; data remains erratic.
4. **Middle-Right Graph**:
- The line demonstrates a consistent downward trend until a mid-point plateau.
- Post-plateau, the line resumes declining with minor fluctuations.
- Trend: Gradual decrease with a temporary stabilization.
5. **Bottom-Left Graph**:
- High-frequency oscillations dominate, with a final sharp spike at the right edge.
- The spike exceeds the amplitude of previous graphs, reaching ~25% of the vertical range.
- No trend; data is highly volatile.
6. **Bottom-Right Graph**:
- The line shows a steady upward trend with minor fluctuations.
- A plateau occurs near the top, followed by a final dip.
- Trend: Increasing then stabilizing.
### Key Observations
- **Volatility**: Left-column graphs (1, 3, 5) exhibit higher noise and sharper spikes compared to the right-column graphs (2, 4, 6).
- **Plateaus**: Right-column graphs (2, 4, 6) include horizontal segments, suggesting potential stabilization or thresholds.
- **Spikes**: All graphs except the middle-right (4) and bottom-right (6) end with a sharp upward or downward spike.
- **Amplitude**: Bottom-left (5) and top-left (1) graphs have the most extreme fluctuations.
### Interpretation
The absence of labels prevents definitive conclusions about the data’s context (e.g., time, measurements). However, the visual patterns suggest:
1. **Left Column (1, 3, 5)**: High variability and abrupt changes, possibly indicating noisy or event-driven data (e.g., sensor errors, market volatility).
2. **Right Column (2, 4, 6)**: Smoother trends with plateaus, potentially representing controlled or filtered data (e.g., smoothed signals, stabilized systems).
3. **Spike Consistency**: The recurring spikes at the right edge of graphs (1, 3, 5) may indicate a systematic anomaly or endpoint artifact.
4. **Plateau Behavior**: The middle-right (4) and bottom-right (6) graphs show deliberate stabilization, possibly reflecting thresholds or target values.
### Limitations
- No numerical values, units, or timeframes are provided, limiting quantitative analysis.
- Lack of legends or axis labels prevents correlation with external variables (e.g., time, categories).
- The purpose of the graphs (e.g., comparison, anomaly detection) remains unclear without contextual metadata.