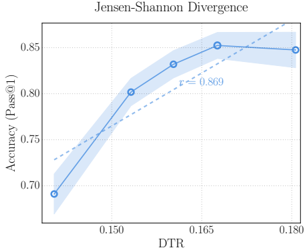
## Scatter Plot: Jensen-Shannon Divergence
### Overview
The image depicts a scatter plot titled "Jensen-Shannon Divergence," showing the relationship between DTR (x-axis) and Accuracy (Pass@1) (y-axis). A blue line with a shaded confidence interval and a dashed trend line are present, along with a correlation coefficient (r = 0.869) annotated near the center.
### Components/Axes
- **X-axis (DTR)**: Labeled "DTR," with values ranging from 0.150 to 0.180.
- **Y-axis (Accuracy)**: Labeled "Accuracy (Pass@1)," with values ranging from 0.70 to 0.85.
- **Legend**: No explicit legend is visible, but the blue line and shaded area are the primary visual elements.
- **Trend Line**: A dashed line with the equation "r = 0.869" annotated near the center of the plot.
### Detailed Analysis
- **Data Points**:
- The blue line starts at approximately (0.150, 0.70) and ends at (0.180, 0.85).
- Intermediate data points include (0.165, 0.85) and (0.175, 0.85), with the shaded area indicating variability around the line.
- **Trend Line**: The dashed line slopes upward, suggesting a positive correlation between DTR and Accuracy. The correlation coefficient (r = 0.869) indicates a strong positive linear relationship.
- **Shaded Area**: The blue shaded region around the line represents the confidence interval or uncertainty in the data.
### Key Observations
- The Accuracy (Pass@1) increases as DTR increases, with a strong positive trend (r = 0.869).
- The shaded area suggests variability in the data, with the line's slope indicating a consistent upward trend.
- The highest Accuracy (0.85) is observed at DTR values of 0.165 and 0.175.
### Interpretation
The data demonstrates a statistically significant positive relationship between DTR and Accuracy (Pass@1), as evidenced by the high correlation coefficient (r = 0.869). The Jensen-Shannon Divergence metric likely quantifies the divergence between distributions, and as DTR increases, the model's performance improves. The shaded area highlights that while the trend is clear, there is some variability in the data points, which could reflect differences in test conditions or data subsets. The dashed trend line reinforces the strong linear relationship, suggesting that DTR is a reliable predictor of Accuracy in this context.