\n
## Diagram: Graph Types
### Overview
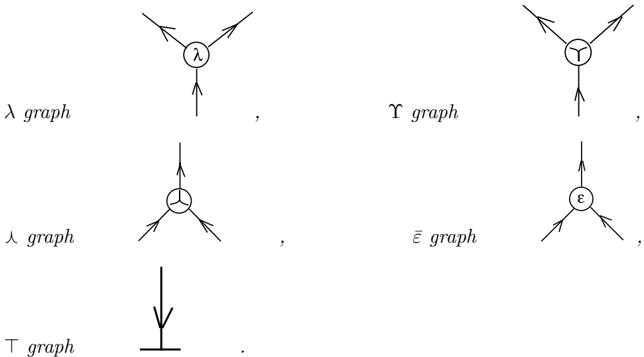
The image presents a collection of diagrams representing different graph types, each labeled with a Greek letter and the term "graph". The diagrams consist of nodes with arrows emanating from them, indicating directed edges.
### Components/Axes
The image contains the following labeled graph types:
* λ graph (appears twice)
* Γ graph
* Ξ graph
* ε graph
* Τ graph
Each graph consists of a central node with three arrows pointing outwards. The Τ graph is an exception, consisting of a vertical line with an arrow pointing downwards.
### Detailed Analysis or Content Details
1. **λ graph (top-left):** A central node labeled "λ" with three arrows pointing outwards.
2. **Γ graph (top-right):** A central node labeled "Γ" with three arrows pointing outwards.
3. **λ graph (center-left):** A central node with a circle inside, and a line through it, labeled "λ" with three arrows pointing outwards.
4. **Ξ graph (center-right):** A central node labeled "Ξ" with three arrows pointing outwards.
5. **ε graph (bottom-right):** A central node labeled "ε" with three arrows pointing outwards.
6. **Τ graph (bottom-center):** A vertical line with an arrow pointing downwards, labeled "Τ".
### Key Observations
All graphs except the Τ graph have a similar structure: a central node with three outgoing arrows. The Τ graph is a distinct, simpler structure. The λ graph appears twice, once with a simple label and once with a circle and line within the node.
### Interpretation
The image likely illustrates different types of graphs used in a specific mathematical or computational context. The Greek letter labels suggest these graphs might represent specific functions, transformations, or relationships within a larger system. The variations in the central node (simple label vs. circle/line) could indicate different properties or constraints associated with each graph type. The Τ graph, being a simpler structure, might represent a base case or a fundamental operation. Without further context, it's difficult to determine the precise meaning of each graph type, but the image clearly aims to categorize and visually distinguish them. The image does not provide any quantitative data, but rather a qualitative representation of different graph structures.