## Bar Chart: Task Execution Times
### Overview
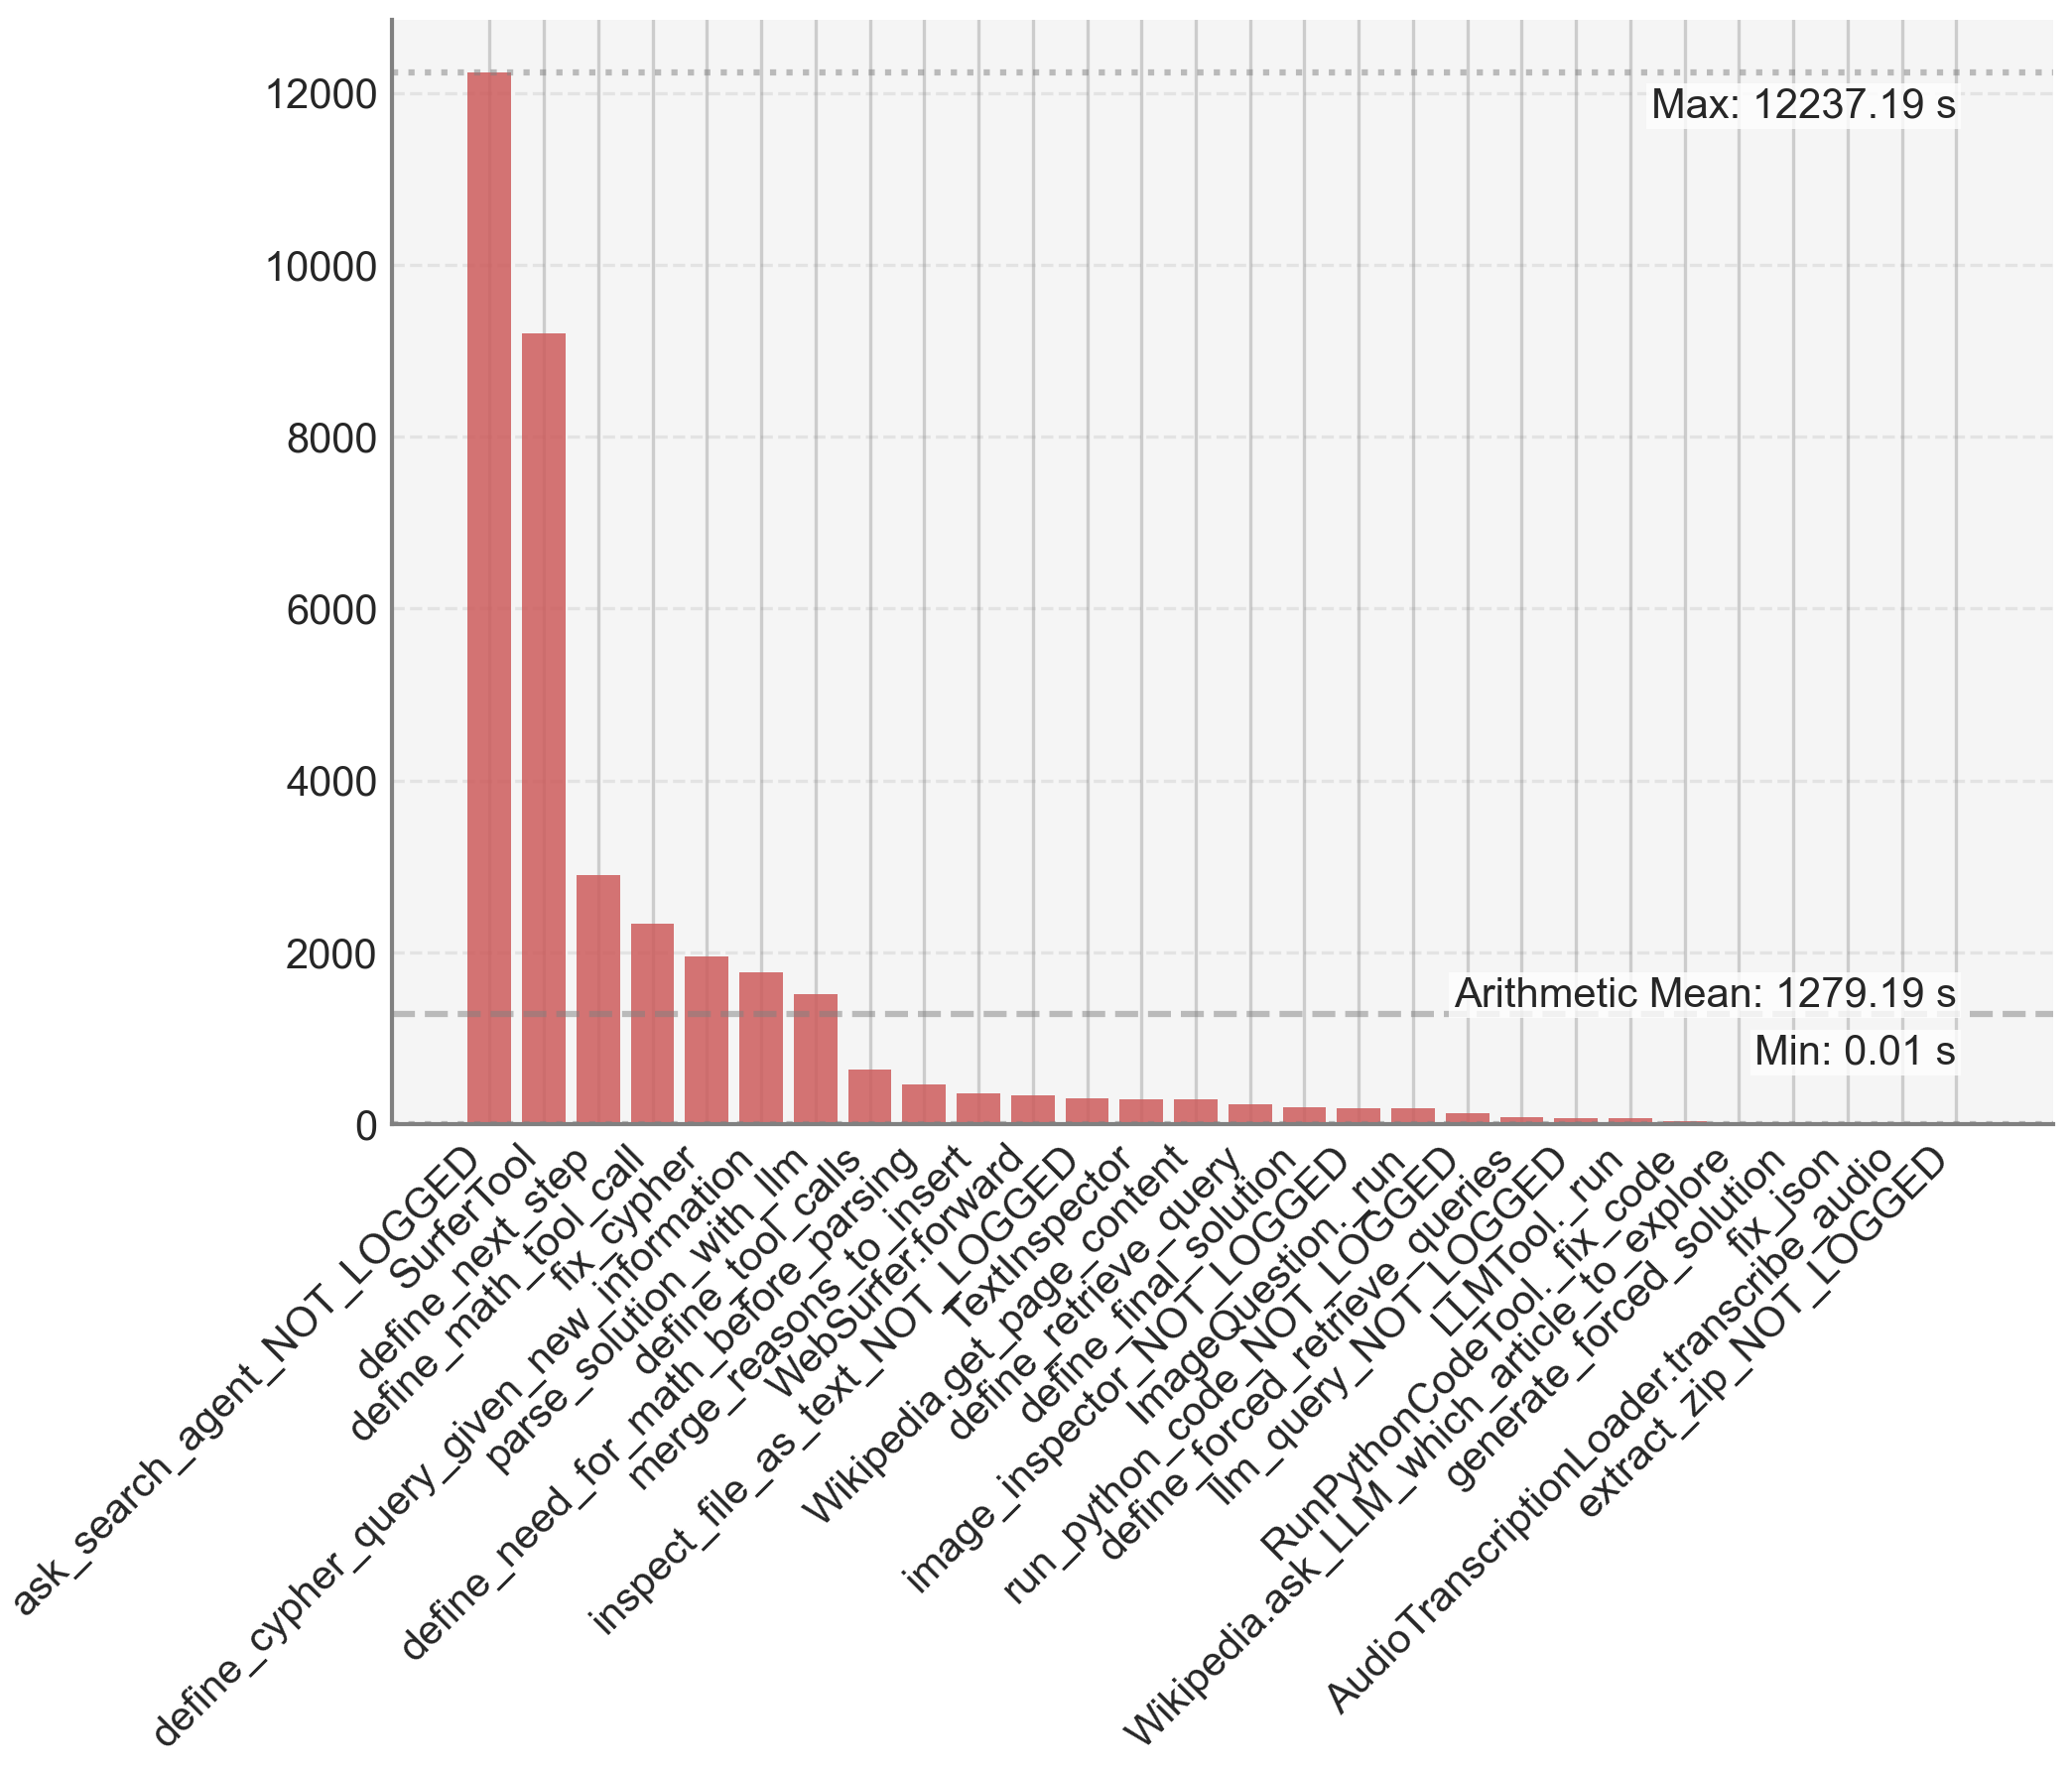
The image is a bar chart displaying the execution times of various tasks. The x-axis represents the task names, and the y-axis represents the execution time in seconds. The bars are colored in a shade of red. The chart also includes horizontal lines indicating the maximum execution time and the arithmetic mean.
### Components/Axes
* **X-axis:** Task names (listed below in "Detailed Analysis")
* Labels are rotated ~45 degrees for readability.
* **Y-axis:** Execution time in seconds (s)
* Scale: 0 to 12000, with increments of 2000.
* **Bars:** Represent the execution time for each task. All bars are the same shade of red.
* **Horizontal Lines:**
* Dotted line at y = 12237.19, labeled "Max: 12237.19 s"
* Dashed line at y = 1279.19, labeled "Arithmetic Mean: 1279.19 s"
* **Minimum Value:** "Min: 0.01 s" is noted at the bottom right.
### Detailed Analysis
The following tasks are listed on the x-axis, along with their approximate execution times (estimated from the bar heights):
1. **ask\_search\_agent\_NOT\_LOGGED:** ~10 s
2. **SurferTool:** ~12200 s
3. **define\_next\_step:** ~9200 s
4. **define\_math\_tool\_call:** ~3000 s
5. **fix\_cypher:** ~2300 s
6. **define\_tool\_calls:** ~2000 s
7. **parse\_solution\_with\_Ilm:** ~1800 s
8. **define\_cypher\_query\_given\_new\_information:** ~1500 s
9. **merge\_reasons\_to\_insert:** ~500 s
10. **define\_need\_for\_math\_before\_parsing:** ~400 s
11. **inspect\_file\_as\_text\_NOT\_LOGGED:** ~400 s
12. **WebSurfer.forward:** ~300 s
13. **Wikipedia.get\_page\_content:** ~300 s
14. **TextInspector:** ~300 s
15. **define\_retrieve\_query:** ~200 s
16. **image\_inspector\_NOT\_LOGGED:** ~200 s
17. **define\_final\_solution:** ~200 s
18. **ImageQuestion.\_run:** ~150 s
19. **run\_python\_code\_NOT\_LOGGED:** ~150 s
20. **Tlm\_query\_NOT LOGGED:** ~100 s
21. **define\_forced\_retrieve\_queries:** ~100 s
22. **Wikipedia.ask\_LLM\_which\_article\_to\_explore:** ~100 s
23. **LLMTool.\_run:** ~100 s
24. **RunPythonCodeTool.\_fix\_code:** ~50 s
25. **generate\_forced\_solution:** ~50 s
26. **fix\_json:** ~50 s
27. **AudioTranscriptionLoader.transcribe\_audio:** ~50 s
28. **extract\_zip\_NOT\_LOGGED:** ~50 s
### Key Observations
* The "SurferTool" task has a significantly higher execution time compared to all other tasks.
* "define\_next\_step" also has a high execution time, though not as high as "SurferTool".
* Most tasks have relatively low execution times, clustered near the bottom of the chart.
* The arithmetic mean execution time (1279.19 s) is heavily influenced by the two tasks with very high execution times.
### Interpretation
The data suggests that the "SurferTool" and "define\_next\_step" tasks are the most time-consuming operations. This could be due to the complexity of these tasks, inefficient code, or external factors such as network latency. The large difference in execution times between these tasks and the others indicates a potential area for optimization. The "NOT\_LOGGED" suffix on some tasks may indicate that execution time logging was not enabled for those tasks, or that those tasks did not generate log data. The arithmetic mean is not a good representation of the typical execution time due to the outliers.