## Bar Chart: Execution Time of Various Functions
### Overview
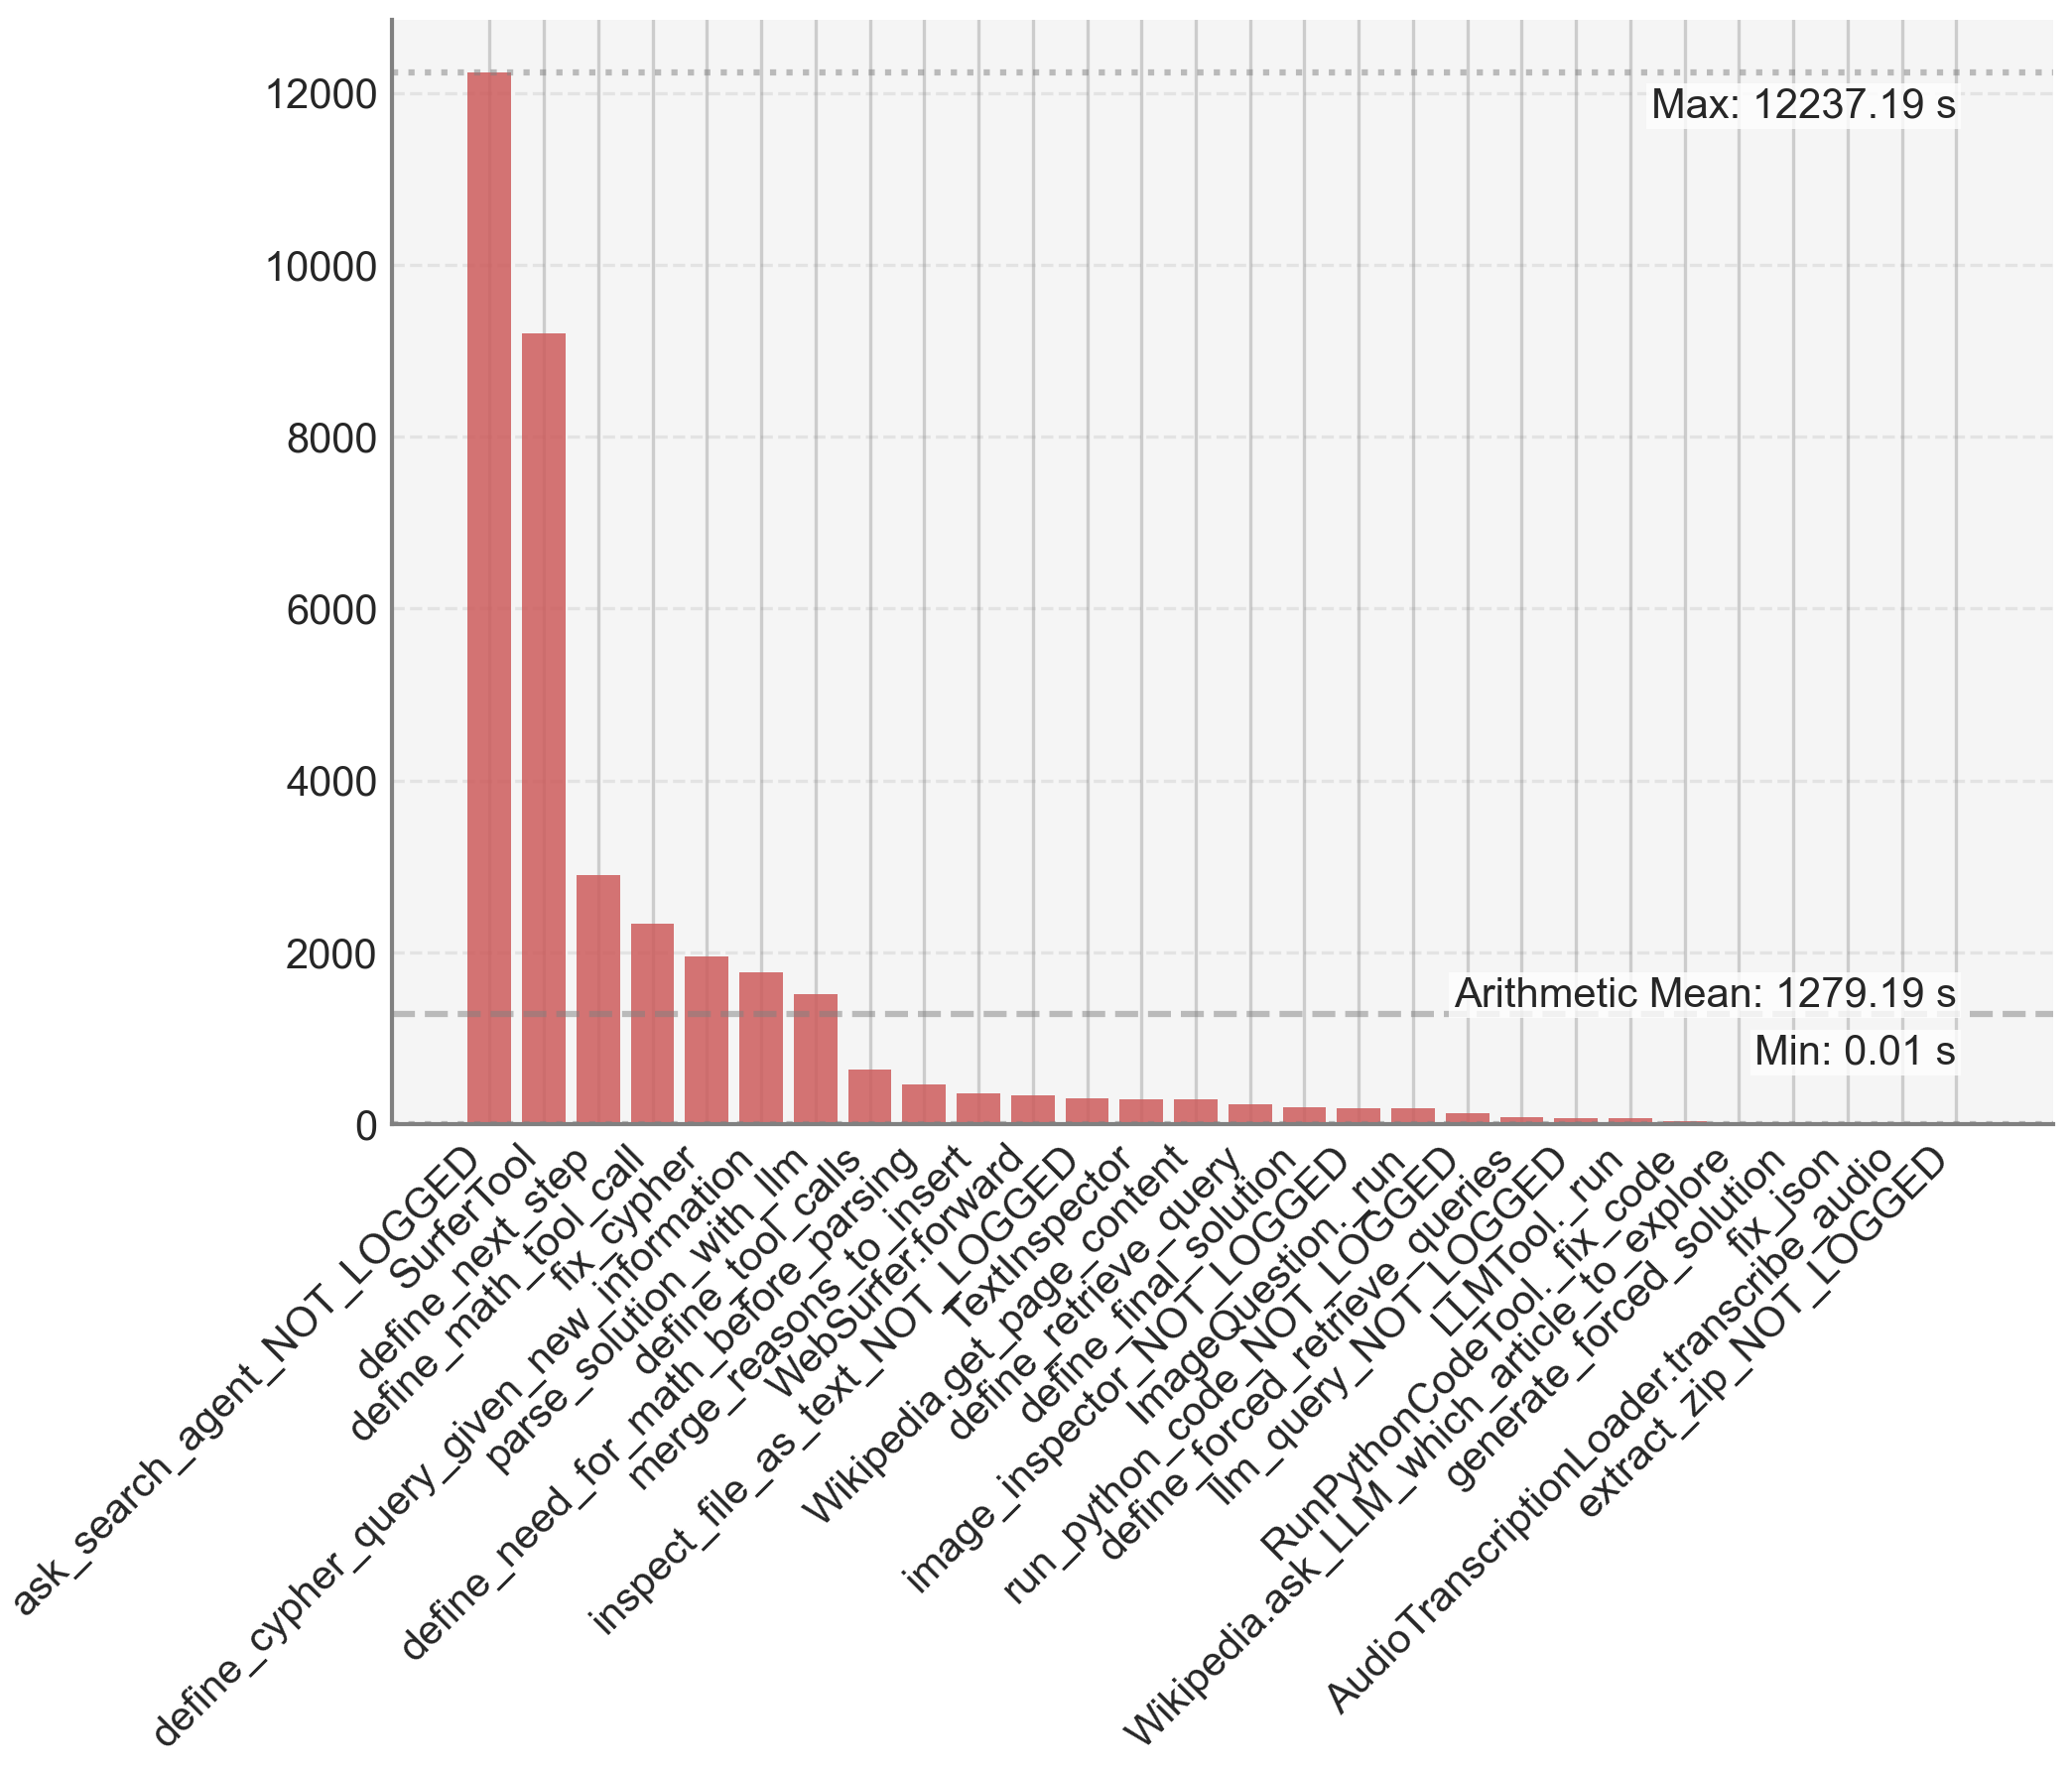
This image presents a bar chart visualizing the execution time of a series of functions, likely within a software or system. The x-axis lists the function names, and the y-axis represents the execution time in seconds. The chart displays a significant variation in execution times across different functions, with some functions taking orders of magnitude longer than others.
### Components/Axes
* **X-axis:** Function Names (categorical)
* **Y-axis:** Execution Time (seconds) - Scale ranges from 0 to 12000, with increments of 2000.
* **Title:** Not explicitly present, but the chart represents "Execution Time of Various Functions".
* **Legend:** Not present. The bars are directly labeled with function names.
* **Annotations:**
* "Max: 12237.19 s" - Located in the top-right corner.
* "Arithmetic Mean: 1279.19 s" - Located in the center-right.
* "Min: 0.01 s" - Located in the center-right.
### Detailed Analysis
The chart displays 24 functions with their corresponding execution times. The functions are listed along the x-axis in the following order:
1. `ask_search_agent_NOT_LOGGED`: ~1000 s
2. `Surfertool`: ~9000 s
3. `define_next_step`: ~8000 s
4. `define_math_tool_call`: ~7000 s
5. `define_new_information`: ~6000 s
6. `parse_solution_with_llm`: ~5000 s
7. `define_tool_calls`: ~4000 s
8. `merge_reasons_to_insert`: ~3000 s
9. `WebSurfer.forward`: ~2500 s
10. `inspect_file_as_text_NOT_LOGGED`: ~2000 s
11. `Wikipedia.get_text`: ~1800 s
12. `define_final_content`: ~1600 s
13. `image_inspector.image_query`: ~1400 s
14. `define_page_content`: ~1200 s
15. `run_python_codeQuestion.run`: ~1000 s
16. `Wikipedia.ask_llm_which_article_forced`: ~800 s
17. `RunPythonCodeTool.run`: ~600 s
18. `tlm_query_NOT_LOGGED`: ~400 s
19. `tImTool.fix_code`: ~300 s
20. `generate_forced_solution`: ~200 s
21. `AudioTranscriptionLoader.transcribe_audio`: ~100 s
22. `extract_zip_NOT_LOGGED`: ~50 s
23. `define_cypher_query`: ~10 s
24. `cypher_NOT_LOGGED`: ~0.01 s
The tallest bar corresponds to `Surfertool` with an execution time of approximately 9000 seconds. The shortest bar corresponds to `cypher_NOT_LOGGED` with an execution time of approximately 0.01 seconds. The execution times generally decrease from left to right, though there are fluctuations.
### Key Observations
* The function `Surfertool` is a significant outlier, taking substantially longer to execute than any other function.
* The execution times are highly variable, spanning over four orders of magnitude (from 0.01s to 12237.19s).
* The arithmetic mean (1279.19 s) is heavily influenced by the few functions with very long execution times.
* The distribution of execution times is right-skewed, with a long tail of functions that take longer to execute.
### Interpretation
The chart suggests that the execution time of these functions varies dramatically. The `Surfertool` function appears to be a performance bottleneck, potentially due to its complexity or the resources it requires. The large difference in execution times indicates that optimizing the slower functions could significantly improve the overall system performance. The right-skewed distribution suggests that a small number of functions are responsible for the majority of the execution time. Further investigation into the `Surfertool` function and other slow functions is warranted to identify opportunities for optimization. The presence of "NOT_LOGGED" in some function names suggests that logging may not be enabled for those functions, which could hinder performance analysis. The chart provides a clear visual representation of the performance characteristics of these functions, enabling developers to prioritize optimization efforts effectively.