## Bar Charts: Description Length vs. Number of Models/Datasets
### Overview
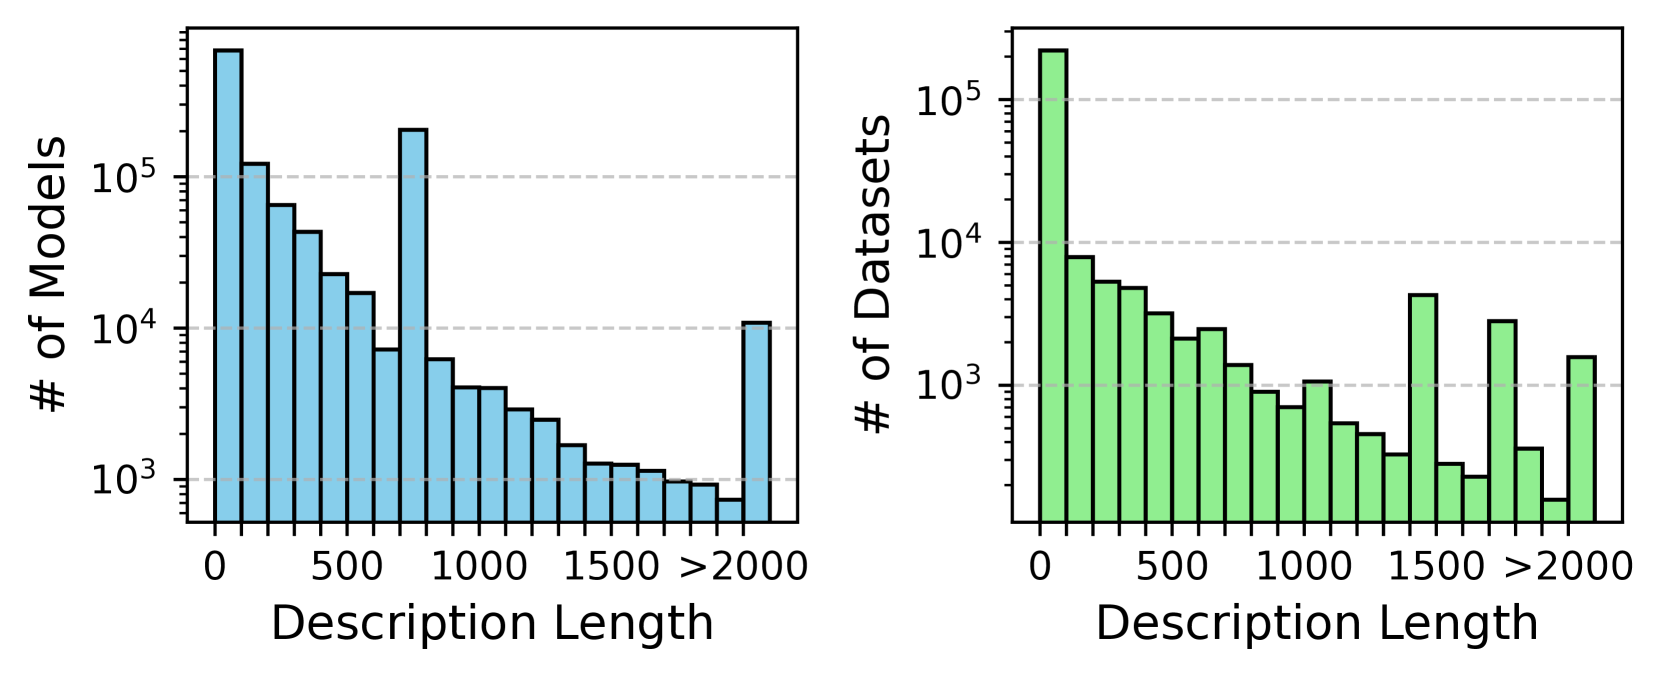
The image presents two bar charts side-by-side. Both charts depict the distribution of description lengths, with the left chart showing the number of models and the right chart showing the number of datasets. The y-axis uses a logarithmic scale.
### Components/Axes
**Left Chart (Models):**
* **Title:** "# of Models"
* **Y-axis:** "# of Models" (logarithmic scale from 10^3 to 10^5)
* **X-axis:** "Description Length"
* **X-axis Markers:** 0, 500, 1000, 1500, ">2000"
* **Bar Color:** Light Blue
**Right Chart (Datasets):**
* **Title:** "# of Datasets"
* **Y-axis:** "# of Datasets" (logarithmic scale from 10^3 to 10^5)
* **X-axis:** "Description Length"
* **X-axis Markers:** 0, 500, 1000, 1500, ">2000"
* **Bar Color:** Light Green
### Detailed Analysis
**Left Chart (Models):**
* **Trend:** The number of models decreases as the description length increases, with a spike at ">2000".
* **Approximate Values:**
* Description Length 0: ~2.5 * 10^5
* Description Length 500: ~4 * 10^4
* Description Length 1000: ~1.5 * 10^5
* Description Length 1500: ~2 * 10^3
* Description Length >2000: ~1 * 10^4
**Right Chart (Datasets):**
* **Trend:** The number of datasets generally decreases as the description length increases, with local maxima at 0, 1500, and >2000.
* **Approximate Values:**
* Description Length 0: ~2 * 10^5
* Description Length 500: ~5 * 10^3
* Description Length 1000: ~7 * 10^2
* Description Length 1500: ~4 * 10^3
* Description Length >2000: ~1.5 * 10^3
### Key Observations
* Both charts show a high concentration of models and datasets with shorter description lengths.
* The number of models with description length around 1000 is higher than expected given the general trend.
* There is a noticeable increase in both models and datasets with description lengths greater than 2000.
### Interpretation
The data suggests that shorter descriptions are more common for both models and datasets. The spike at ">2000" could indicate a category of models and datasets with very long, potentially detailed descriptions. The difference in distribution between models and datasets at description length 1000 suggests that models may have a preference for descriptions of this length. The overall trend indicates a preference for concise descriptions, possibly due to ease of understanding or storage limitations.