\n
## Bar Charts: Distribution of Description Lengths for Models and Datasets
### Overview
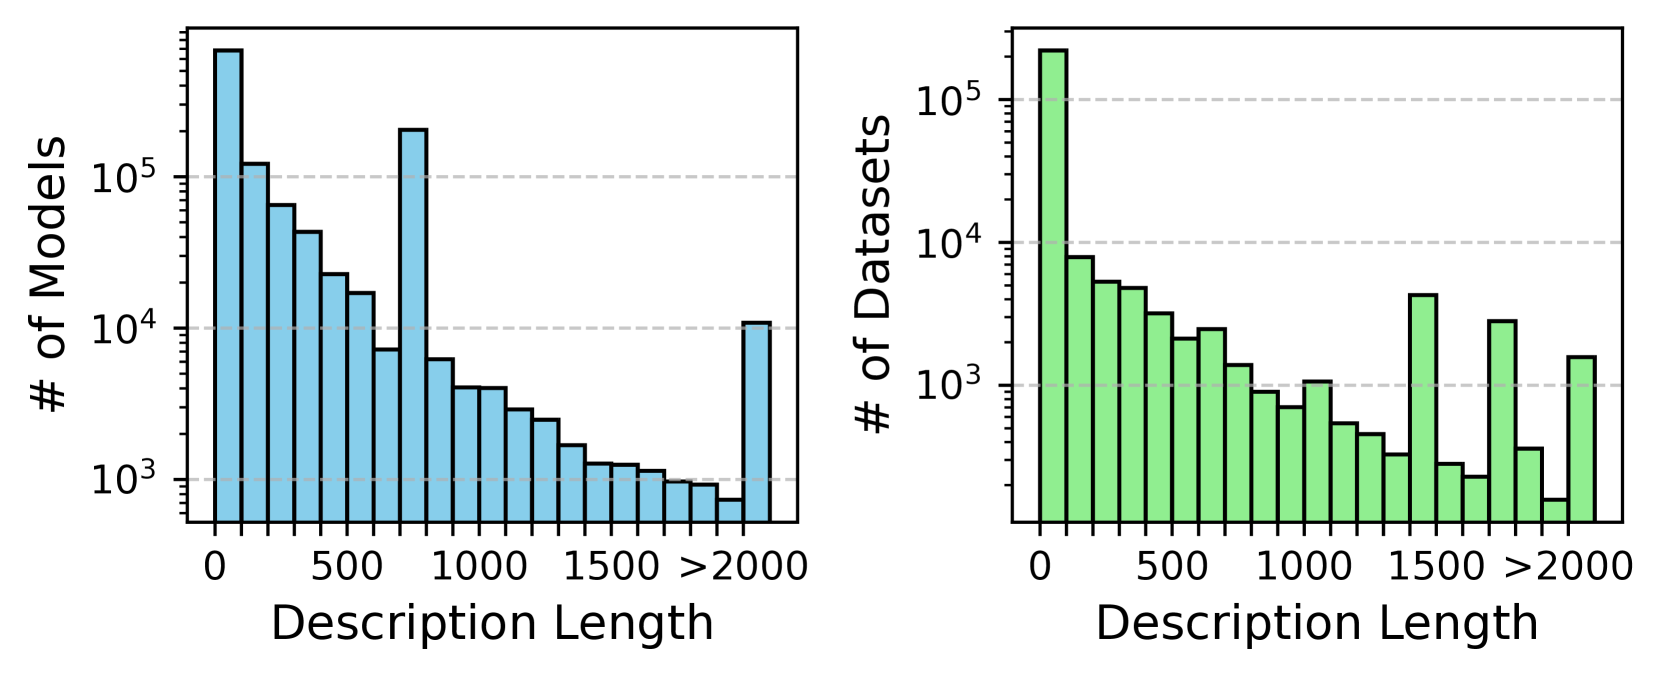
The image presents two bar charts side-by-side. The left chart shows the distribution of description lengths for a collection of models, while the right chart displays the distribution of description lengths for a collection of datasets. Both charts use a logarithmic scale on the y-axis. The x-axis represents description length, categorized into bins.
### Components/Axes
* **Left Chart:**
* **Title:** "# of Models"
* **X-axis Label:** "Description Length"
* **Y-axis Label:** "# of Models" (Logarithmic Scale)
* **X-axis Categories:** 0, 500, 1000, 1500, >2000
* **Bar Color:** Light Blue
* **Right Chart:**
* **Title:** "# of Datasets"
* **X-axis Label:** "Description Length"
* **Y-axis Label:** "# of Datasets" (Logarithmic Scale)
* **X-axis Categories:** 0, 500, 1000, 1500, >2000
* **Bar Color:** Light Green
* **Both Charts:**
* **Horizontal dashed lines:** Present at y-axis values of 10^3, 10^4, and 10^5.
### Detailed Analysis or Content Details
**Left Chart (Models):**
The left chart shows a decreasing trend in the number of models as description length increases. The highest frequency of models occurs at the 0 description length bin.
* **0:** Approximately 2.5 x 10^5 models.
* **500:** Approximately 1.8 x 10^5 models.
* **1000:** Approximately 6.0 x 10^4 models.
* **1500:** Approximately 3.0 x 10^4 models.
* **>2000:** Approximately 1.0 x 10^4 models.
**Right Chart (Datasets):**
The right chart shows a similar decreasing trend, but with more fluctuations. The highest frequency of datasets occurs at the 0 description length bin.
* **0:** Approximately 1.0 x 10^6 datasets.
* **500:** Approximately 6.0 x 10^4 datasets.
* **1000:** Approximately 2.5 x 10^4 datasets.
* **1500:** Approximately 1.0 x 10^4 datasets.
* **>2000:** Approximately 3.0 x 10^3 datasets.
### Key Observations
* Both charts exhibit a right-skewed distribution, indicating that most models and datasets have short descriptions.
* The number of models and datasets decreases rapidly as description length increases.
* The dataset chart shows a slight increase in the number of datasets in the >2000 description length bin compared to the 1500 bin, which is not observed in the model chart.
* The y-axis is on a logarithmic scale, which emphasizes the differences in the number of models and datasets at different description lengths.
### Interpretation
The data suggests that, in general, models and datasets tend to have short descriptions. This could be due to several factors, such as:
* **Practicality:** Short descriptions are easier to write and maintain.
* **Automation:** Automated description generation tools may produce shorter descriptions.
* **Lack of Importance:** Description length may not be considered a critical factor in model or dataset quality.
The difference in the distribution of description lengths between models and datasets could indicate that datasets are more likely to have longer descriptions than models. This might be because datasets often require more detailed explanations of their content and structure. The slight increase in datasets with very long descriptions (>2000) could be due to a small number of highly complex datasets that require extensive documentation. The logarithmic scale is crucial for understanding the magnitude of the differences, as the absolute numbers are significantly different between the two charts. The dashed lines on the y-axis provide visual reference points for the scale.