## Histograms: Distribution of Description Lengths for Models and Datasets
### Overview
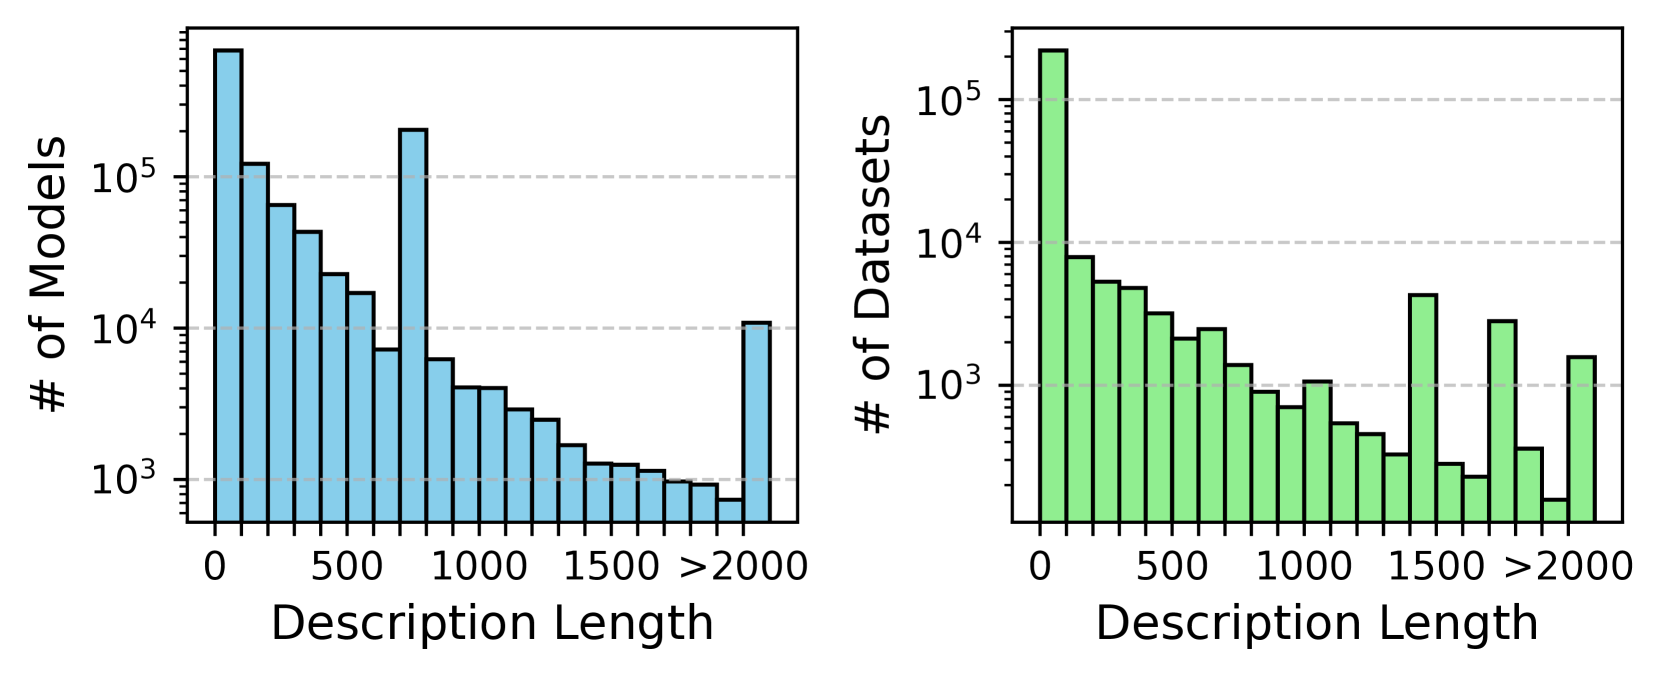
The image displays two side-by-side histograms with a logarithmic y-axis. The left histogram (blue bars) shows the distribution of description lengths for a collection of "Models." The right histogram (green bars) shows the distribution for "Datasets." Both charts share the same x-axis representing "Description Length" in characters or tokens, binned into ranges. The overall trend in both distributions is a strong right skew, with the vast majority of entries having short descriptions.
### Components/Axes
* **Chart Layout:** Two independent histograms placed horizontally adjacent.
* **Left Histogram (Blue):**
* **Y-axis Label:** "# of Models" (vertical text, left side).
* **Y-axis Scale:** Logarithmic, with major gridlines and labels at 10³, 10⁴, and 10⁵.
* **X-axis Label:** "Description Length" (centered below both charts).
* **X-axis Ticks/Bins:** Labeled at 0, 500, 1000, 1500, and >2000. The bars suggest bins of approximately 250 units in width (e.g., 0-250, 250-500, etc.), with the final bin capturing all lengths greater than 2000.
* **Right Histogram (Green):**
* **Y-axis Label:** "# of Datasets" (vertical text, left side of its plot area).
* **Y-axis Scale:** Logarithmic, with major gridlines and labels at 10³, 10⁴, and 10⁵.
* **X-axis Label:** Shared with the left chart: "Description Length".
* **X-axis Ticks/Bins:** Identical to the left chart: 0, 500, 1000, 1500, >2000.
* **Visual Elements:** Both charts use a light gray dashed grid for the y-axis major ticks. The bars are solid-colored with black outlines.
### Detailed Analysis
**Left Histogram: # of Models vs. Description Length (Blue Bars)**
* **Trend:** The distribution peaks sharply in the first bin (0-250) and then generally decays exponentially as description length increases. There is a notable secondary peak in the bin just before 1000 (likely 750-1000). The final bin (>2000) shows a significant increase compared to the bins immediately preceding it.
* **Approximate Data Points (Log Scale Interpretation):**
* Bin 0-250: ~5 x 10⁵ (500,000) models. This is the highest bar, extending above the 10⁵ line.
* Bin 250-500: ~1.2 x 10⁵ (120,000) models.
* Bin 500-750: ~7 x 10⁴ (70,000) models.
* Bin 750-1000: ~2 x 10⁵ (200,000) models. This is the prominent secondary peak.
* Bin 1000-1250: ~6 x 10³ (6,000) models.
* Bin 1250-1500: ~4 x 10³ (4,000) models.
* Bin 1500-1750: ~2 x 10³ (2,000) models.
* Bin 1750-2000: ~1 x 10³ (1,000) models.
* Bin >2000: ~1 x 10⁴ (10,000) models.
**Right Histogram: # of Datasets vs. Description Length (Green Bars)**
* **Trend:** Similar to the models chart, the distribution is heavily concentrated in the shortest description bin. It decays rapidly, with a less pronounced secondary peak around 1500. The final bin (>2000) also shows a notable count.
* **Approximate Data Points (Log Scale Interpretation):**
* Bin 0-250: ~2 x 10⁵ (200,000) datasets. The highest bar.
* Bin 250-500: ~8 x 10³ (8,000) datasets.
* Bin 500-750: ~5 x 10³ (5,000) datasets.
* Bin 750-1000: ~3 x 10³ (3,000) datasets.
* Bin 1000-1250: ~1 x 10³ (1,000) datasets.
* Bin 1250-1500: ~5 x 10² (500) datasets.
* Bin 1500-1750: ~4 x 10³ (4,000) datasets. This is the secondary peak.
* Bin 1750-2000: ~3 x 10³ (3,000) datasets.
* Bin >2000: ~1.5 x 10³ (1,500) datasets.
### Key Observations
1. **Dominance of Short Descriptions:** For both models and datasets, the overwhelming majority (likely >80%) have descriptions shorter than 250 units.
2. **Secondary Peaks:** Both distributions exhibit non-monotonic decay. Models have a strong secondary mode around a description length of 750-1000. Datasets have a smaller secondary mode around 1500-1750.
3. **Long Tail:** A non-trivial number of entries have very long descriptions (>2000 units). For models, this count (~10,000) is higher than for any single bin between 1000-2000.
4. **Scale Difference:** The total number of models appears to be higher than the total number of datasets, as indicated by the higher peak value on the left chart's y-axis.
### Interpretation
These histograms reveal a common pattern in metadata documentation: brevity is the norm. The data suggests that most model and dataset creators provide minimal descriptions, likely just a title or a single sentence. The secondary peaks are intriguing; they may correspond to a common template or standard description length adopted by a significant subset of the community (e.g., a standard abstract length of ~500 words, which might translate to ~2500 characters, but the bins here are likely in characters, so a 750-character peak could be a common "short paragraph" standard).
The presence of a substantial "long tail" (>2000) indicates a subset of entries with extensive documentation, which could be research papers, detailed technical reports, or automatically generated comprehensive metadata. The difference in the location of secondary peaks between models (~1000) and datasets (~1500) might hint at different documentation practices or requirements for these two types of assets. Overall, the charts highlight a potential area for improvement in data and model discoverability and reproducibility, as short descriptions may lack the necessary detail for effective understanding and reuse.