## Bar Charts: Description Length Distribution for Models and Datasets
### Overview
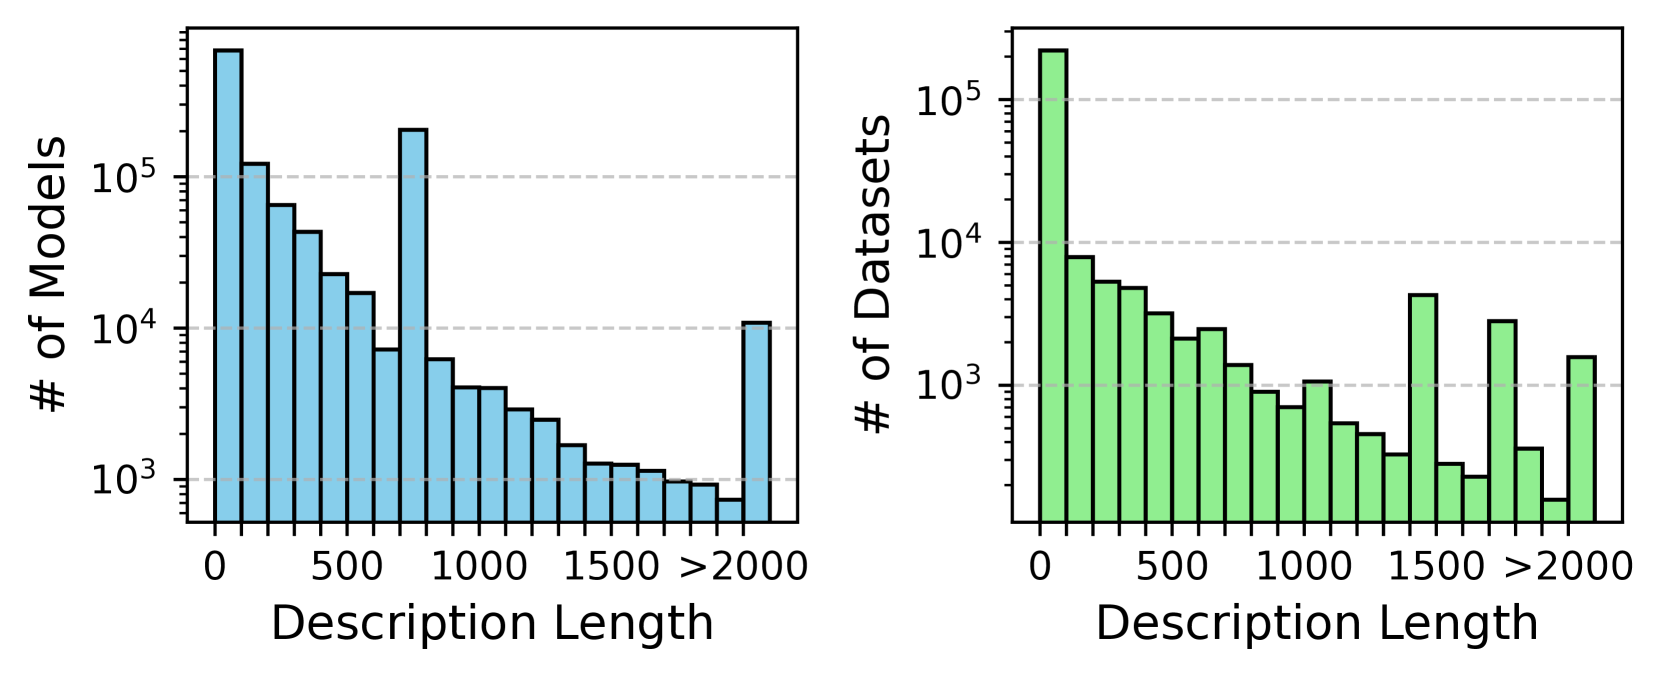
The image contains two side-by-side bar charts comparing the distribution of description lengths for models (blue) and datasets (green). Both charts use a logarithmic y-axis scale (10³ to 10⁵) and share identical x-axis categories: 0, 500, 1000, 1500, and ">2000".
### Components/Axes
- **X-axis (Description Length)**: Categorical bins (0, 500, 1000, 1500, >2000)
- **Y-axis (Left Chart)**: "# of Models" (log scale: 10³–10⁵)
- **Y-axis (Right Chart)**: "# of Datasets" (log scale: 10³–10⁵)
- **Legend**: Blue = Models, Green = Datasets (positioned top-center)
### Detailed Analysis
#### Models (Blue Chart)
- **0**: ~10⁵ models (tallest bar)
- **500**: ~10⁴.5 models
- **1000**: ~10⁴ models
- **1500**: ~10³.5 models
- **>2000**: ~10⁴ models (unexpected spike)
#### Datasets (Green Chart)
- **0**: ~10⁵ datasets (tallest bar)
- **500**: ~10⁴.5 datasets
- **1000**: ~10⁴ datasets
- **1500**: ~10³.5 datasets
- **>2000**: ~10³ datasets (smaller spike than models)
### Key Observations
1. **Consistent Decline**: Both charts show a logarithmic decline in counts as description length increases from 0 to 1500.
2. **Anomalous Spike**: The ">2000" category contains disproportionately high counts for models (~10⁴) compared to datasets (~10³), suggesting a potential outlier or categorization error.
3. **Scale Sensitivity**: The logarithmic y-axis emphasizes the dominance of short descriptions (0–1500) while still revealing tail-end distributions.
### Interpretation
The data suggests that most models and datasets are described with relatively short text (<1500 characters), with a long-tail distribution. The spike in models at ">2000" could indicate:
- A distinct subset of complex models requiring longer descriptions
- Data quality issues (e.g., misclassified description lengths)
- A fundamental difference in how models vs. datasets are documented
The logarithmic scale reveals that while short descriptions dominate, the tail behavior differs significantly between models and datasets. This divergence might reflect differing documentation practices or inherent complexity differences between the two categories.