# Technical Document Extraction: Perplexity vs. Context Chart
## 1. Component Isolation
* **Header:** None present.
* **Main Chart Area:** A line graph plotted on a Cartesian coordinate system with a light gray dashed grid.
* **Axes:**
* **Y-Axis (Vertical):** Labeled "Perplexity".
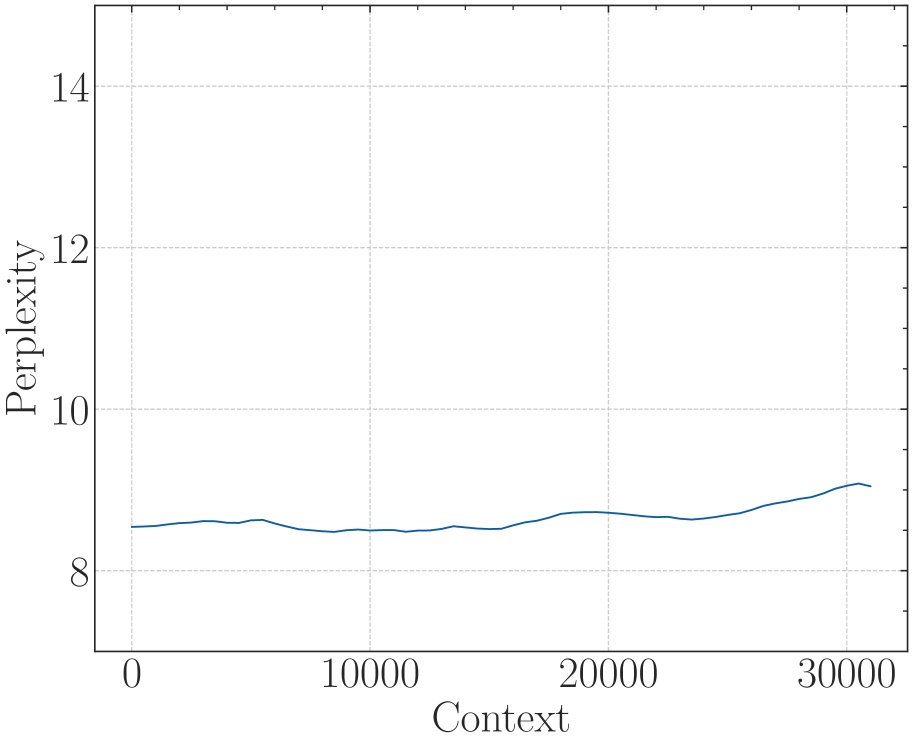
* **X-Axis (Horizontal):** Labeled "Context".
* **Legend:** None present.
## 2. Axis Details and Markers
### Y-Axis: Perplexity
* **Label:** Perplexity (oriented vertically).
* **Scale:** Linear.
* **Major Tick Marks:** 8, 10, 12, 14.
* **Minor Tick Marks:** Present between major ticks (representing increments of 1 unit, with smaller sub-ticks likely representing 0.5 or 0.2 units).
* **Range:** The visible axis starts at approximately 7 and extends to 15.
### X-Axis: Context
* **Label:** Context (oriented horizontally).
* **Scale:** Linear.
* **Major Tick Marks:** 0, 10000, 20000, 30000.
* **Range:** The visible axis starts at 0 and extends slightly past 30000 (to approximately 32000).
## 3. Data Series Analysis
### Series 1: Blue Line
* **Color:** Dark Blue.
* **Trend Verification:** The line exhibits a relatively stable, slightly oscillating horizontal trend for the first two-thirds of the chart, followed by a gradual upward slope in the final third.
* **0 to 15,000 Context:** The line fluctuates narrowly between approximately 8.5 and 8.7.
* **15,000 to 20,000 Context:** The line shows a slight upward trend, peaking near 8.8.
* **20,000 to 25,000 Context:** The line dips slightly and stabilizes around 8.7.
* **25,000 to 31,000 Context:** The line shows a consistent upward trend, reaching its maximum value.
### Estimated Data Points (Visual Extraction)
| Context (X) | Perplexity (Y) |
| :--- | :--- |
| 0 | ~8.55 |
| 5,000 | ~8.65 |
| 10,000 | ~8.50 |
| 15,000 | ~8.55 |
| 20,000 | ~8.75 |
| 25,000 | ~8.70 |
| 30,000 | ~9.10 |
| 31,000 (End) | ~9.05 |
## 4. Summary of Information
This chart illustrates the relationship between "Context" (likely context window size in a machine learning model) and "Perplexity" (a measurement of how well a probability distribution or probability model predicts a sample).
The data indicates that the model maintains a very stable perplexity (between 8.5 and 8.8) for context lengths up to approximately 25,000. Beyond 25,000, there is a measurable but gradual increase in perplexity, suggesting a slight degradation in predictive performance as the context window reaches its maximum observed limit of ~31,000.