## Data Array: Choice Selections
### Overview
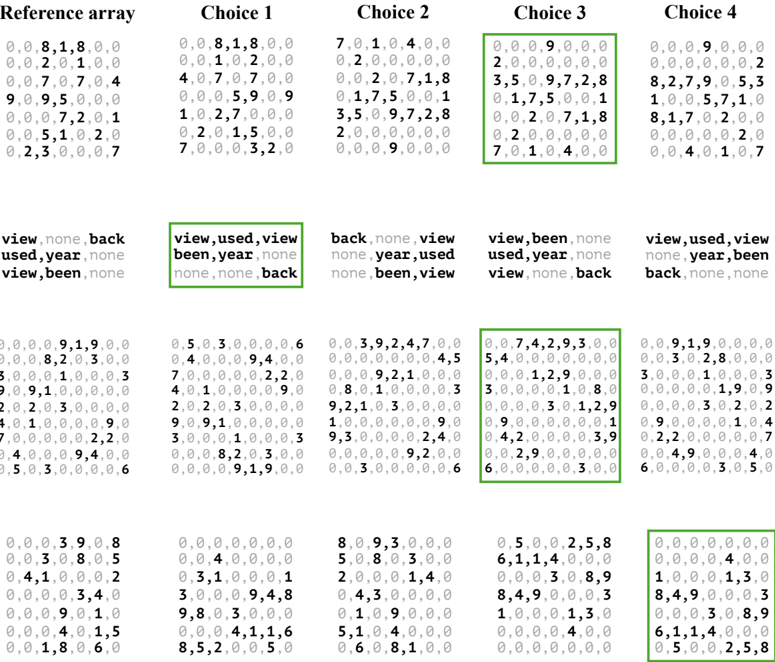
The image presents four arrays of numerical data, labeled "Choice 1" through "Choice 4", alongside a "Reference array". Each array is accompanied by a row of text labels. The arrays appear to represent selections or preferences, with the numerical values potentially indicating strength or frequency of those selections.
### Components/Axes
* **Reference array:** Located at the top-left corner. Contains numerical values.
* **Choice 1-4:** Four arrays positioned to the right of the Reference array, arranged in a row. Each contains numerical values.
* **Text Labels:** Below each array, a row of text labels is present.
* **Color Coding:** The numerical values within each array are color-coded, with a legend at the bottom of the image. The legend maps colors to numerical ranges.
* **Legend:** Located at the bottom of the image. It shows a gradient of colors and corresponding numerical ranges. The colors are:
* White: 0.0
* Light Blue: 0.1 - 0.2
* Medium Blue: 0.3 - 0.4
* Dark Blue: 0.5 - 0.6
* Green: 0.7 - 0.8
* Yellow: 0.9
* Red: 1.0
### Detailed Analysis or Content Details
**Reference array:**
The Reference array contains the following values (approximate):
0.0, 0.8, 1.8, 0.0, 0.0, 2.0, 1.0, 0.4, 9.0, 9.5, 0.0, 0.0, 0.0, 7.2, 0.1, 0.0, 5.1, 1.2, 0.7, 0.0, 2.3, 3.0, 3.2, 0.0
**Choice 1:**
The values in Choice 1 are:
0.0, 0.8, 1.8, 0.0, 0.0, 2.0, 1.0, 0.4, 4.0, 7.0, 0.0, 1.0, 2.7, 0.0, 0.0, 0.0, 7.0, 0.0, 5.0, 3.2, 0.0
Text label: "view, used, view, been, year, none, none, none, back"
**Choice 2:**
The values in Choice 2 are:
7.0, 1.0, 4.0, 0.0, 0.0, 2.0, 0.0, 0.0, 0.0, 2.0, 7.1, 8, 1.7, 5.0, 0.1, 3.5, 5.0, 9.7, 2.8, 2.0, 0.0, 0.0, 0.0
Text label: "back, none, view, none, year, used, none, been, view"
**Choice 3:**
The values in Choice 3 are:
2.0, 0.0, 9.0, 0.0, 0.0, 0.0, 0.0, 0.0, 3.5, 0.9, 7.2, 8, 1.7, 5.0, 0.1, 0.0, 2.0, 7.1, 8, 7.0, 1.0, 4.0, 0.0
Text label: "view, been, none, used, year, none, view, back, none"
**Choice 4:**
The values in Choice 4 are:
0.0, 0.0, 9.0, 0.0, 0.0, 0.0, 0.0, 0.2, 8.2, 7.9, 0.5, 3, 1.0, 0.5, 7.1, 8.1, 7.2, 0.0, 2.0, 0.0, 4.0, 1.0, 7
Text label: "view, used, view, none, year, back, none, been, view"
**Bottom Row Arrays:**
Each of the four bottom row arrays contains similar numerical values to the arrays above them. The values are:
* Array 1: 0.0, 5.0, 3.0, 9.1, 9.0, 6, 4.0, 3.0, 9.4, 0.0, 7.0, 0.0, 2.2, 2.0, 4.1, 1.0, 3.0, 0.0, 9.2, 1.0, 3.3, 0.0
* Array 2: 0.0, 5.0, 3.0, 9.1, 9.0, 6, 4.0, 3.0, 9.4, 0.0, 7.0, 0.0, 2.2, 2.0, 4.1, 1.0, 3.0, 0.0, 9.2, 1.0, 3.3, 0.0
* Array 3: 0.0, 3.9, 2.4, 7.0, 0.0, 4.5, 0.0, 0.0, 9.2, 1.0, 3.0, 0.0, 0.0, 1.2, 8.8, 0.0, 3.0, 1.0, 2.0, 0.0, 0.0, 0.0
* Array 4: 0.0, 9.1, 9.0, 3.0, 0.0, 0.0, 5.4, 0.0, 4.2, 9.3, 0.0, 3.0, 1.2, 9.8, 0.0, 0.0, 3.0, 1.0, 1.8, 0.0, 2.9, 4.3
### Key Observations
* The "Reference array" appears to serve as a baseline or control.
* The text labels below each array suggest categories or features being evaluated ("view", "used", "year", "none", "back", "been").
* The color coding indicates the strength of selection for each category. Red (1.0) represents the strongest selection, while white (0.0) represents no selection.
* There is a high degree of similarity between the values in "Choice 1" and the "Reference array".
* "Choice 2" and "Choice 4" have several high values (red) in the range of 7.0-9.0.
* The bottom row arrays seem to be a repetition of the top arrays, potentially representing a different dimension or iteration of the same data.
### Interpretation
This data likely represents user preferences or selections across different choices. The "Reference array" could be a default or average preference profile. The "Choices" represent alternative profiles, potentially generated by different users or under different conditions. The text labels indicate the features or categories being considered when making these selections.
The high values in "Choice 2" and "Choice 4" suggest that these profiles strongly favor certain features (indicated by the red color). The similarity between "Choice 1" and the "Reference array" suggests that this profile closely aligns with the default or average preference.
The repetition of the arrays in the bottom row could indicate a second-order analysis or a different perspective on the same data. For example, it could represent the frequency of each selection within each choice.
Without further context, it's difficult to determine the specific meaning of the features ("view", "used", "year", etc.). However, the data suggests a clear pattern of preferences and variations across different choices.