## Table: Reference Array and Choice Options
### Overview
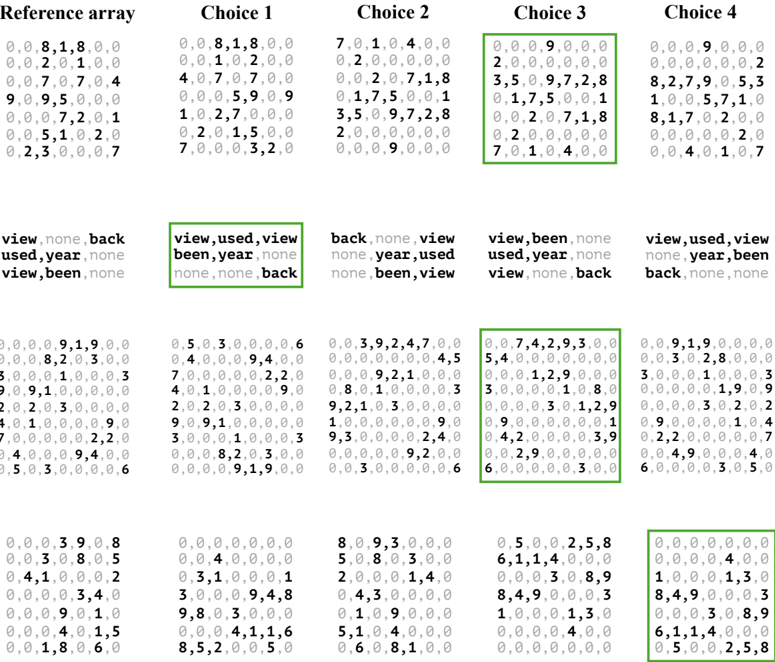
The image presents a structured table with four columns labeled "Reference array," "Choice 1," "Choice 2," "Choice 3," and "Choice 4." Each column contains numerical data organized in rows, with some rows highlighted in green. Below each column, there are textual labels or categories, such as "view,used,view" or "back,none,back." The table appears to compare numerical values across different choices, with annotations indicating specific patterns or selections.
---
### Components/Axes
- **Columns**:
- **Reference array**: Contains a sequence of numerical values (e.g., `0,0,8,1,8,0,0`).
- **Choice 1**: Numerical data with annotations like "view,used,view" and "used,year,none."
- **Choice 2**: Numerical data with annotations like "back,none,back" and "used,year,none."
- **Choice 3**: Numerical data with annotations like "view,been,none" and "used,year,back."
- **Choice 4**: Numerical data with annotations like "view,used,view" and "back,none,back."
- **Rows**: Each row contains numerical values (e.g., `0,0,8,1,8,0,0`) and corresponding textual labels below the columns.
- **Annotations**: Green boxes highlight specific entries in "Choice 3" and "Choice 4," suggesting selected or significant data points.
---
### Detailed Analysis
#### Numerical Data
- **Reference array**:
- Rows: `0,0,8,1,8,0,0`; `0,0,2,0,1,0,0`; `0,0,7,0,7,0,4`; `9,0,9,5,0,0,0`; `0,0,0,7,2,0,1`; `0,0,5,1,0,2,0`; `0,2,3,0,0,0,7`.
- **Choice 1**:
- Rows: `0,0,8,1,8,0,0`; `0,0,1,0,2,0,0`; `4,0,7,0,7,0,0`; `0,0,5,9,0,9,0`; `1,0,2,7,0,0,0`; `0,0,2,0,1,5,0`; `7,0,0,0,3,2,0`.
- **Choice 2**:
- Rows: `7,0,1,0,4,0,0`; `0,0,0,0,0,0,0`; `0,0,2,0,7,1,8`; `0,1,7,5,0,0,1`; `3,5,0,9,7,2,8`; `2,0,0,0,0,0,0`; `0,0,0,0,9,0,0`.
- **Choice 3**:
- Rows: `0,0,0,9,0,0,0`; `2,0,0,0,0,0,0`; `3,5,0,9,7,0,1`; `0,1,7,5,0,0,1`; `0,0,2,0,7,1,8`; `0,2,0,0,0,0,0`; `7,0,1,0,4,0,0`.
- **Choice 4**:
- Rows: `0,0,0,9,0,0,0`; `0,0,0,0,0,0,2`; `8,2,7,9,0,5,3`; `1,0,0,5,7,1,0`; `8,1,7,0,2,0,0`; `0,0,0,0,0,2,0`; `0,0,4,0,1,0,7`.
#### Textual Labels
- **Below columns**:
- **Choice 1**: `view,used,view`; `used,year,none`; `view,been,none`.
- **Choice 2**: `back,none,back`; `used,year,none`; `view,been,none`.
- **Choice 3**: `view,used,view`; `back,none,back`; `view,been,none`.
- **Choice 4**: `view,used,view`; `back,none,back`; `view,none,back`.
#### Green Boxes
- **Choice 3**: Highlighted rows include `0,0,0,9,0,0,0` and `7,0,1,0,4,0,0`.
- **Choice 4**: Highlighted rows include `0,0,0,9,0,0,0` and `0,0,0,0,0,0,2`.
---
### Key Observations
1. **Numerical Patterns**:
- The "Reference array" contains a mix of zeros and non-zero values, with some rows having higher concentrations of non-zero entries (e.g., `9,0,9,5,0,0,0`).
- "Choice 3" and "Choice 4" show repeated zeros in certain rows, suggesting potential default or neutral values.
2. **Annotations**:
- Textual labels like "view,used,view" and "back,none,back" may represent categorical variables or conditions influencing the numerical data.
- Green boxes in "Choice 3" and "Choice 4" likely indicate selected or optimal choices based on the data.
3. **Inconsistencies**:
- The last row in "Choice 3" has seven elements (`7,0,1,0,4,0,0`), while others have five, which may indicate a formatting error or a special case.
---
### Interpretation
- **Data Meaning**: The table likely compares performance metrics, scores, or outcomes across four choices, with the "Reference array" serving as a baseline. The annotations (e.g., "view,used,view") might represent variables or conditions affecting the choices.
- **Relationships**:
- The green boxes in "Choice 3" and "Choice 4" suggest these options are prioritized or validated by the data.
- The textual labels below each column could indicate categories (e.g., "view," "used," "back") that are being evaluated or compared.
- **Outliers/Anomalies**:
- The last row in "Choice 3" has an extra element, which may be a data entry error or a unique case requiring further investigation.
- The repeated zeros in "Choice 2" and "Choice 4" might indicate neutral or inactive states for certain rows.
---
### Conclusion
This table provides a structured comparison of numerical data across four choices, with annotations and highlighted entries suggesting specific patterns or selections. The textual labels and green boxes indicate categorical variables and prioritized options, respectively. Further analysis would require contextual information about the variables and their significance.