## Flowchart: Model Card Framework
### Overview
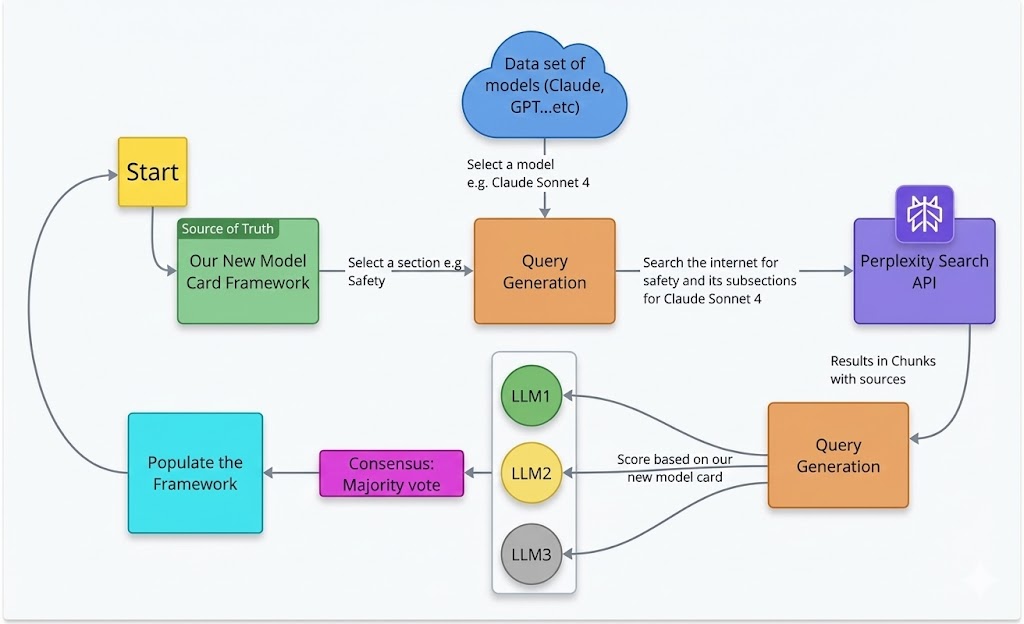
The image is a flowchart illustrating a process for evaluating and populating a model card framework. It involves data from various models, query generation, internet searches, and a consensus mechanism.
### Components/Axes
* **Nodes:** The flowchart consists of several nodes, each represented by a colored rectangle or cloud shape, indicating different stages or components of the process.
* **Arrows:** Arrows indicate the flow of information and the sequence of steps.
* **Colors:** Different colors are used to distinguish between different types of nodes.
* Yellow: Start
* Green: Source of Truth, LLM1
* Orange: Query Generation
* Blue: Data set of models, Populate the Framework, Perplexity Search API
* Purple: Consensus
* Gray: LLM3
* Yellow: LLM2
* **Text Labels:** Each node contains text describing its function or content.
### Detailed Analysis
1. **Start:** The process begins with a yellow node labeled "Start" located at the top-left.
2. **Source of Truth:** From "Start", a curved arrow leads to a green rectangle labeled "Source of Truth: Our New Model Card Framework".
3. **Data Set of Models:** A blue cloud shape at the top-center is labeled "Data set of models (Claude, GPT...etc)". Below this cloud, the text "Select a model e.g. Claude Sonnet 4" is present.
4. **Query Generation (1):** From "Source of Truth", an arrow labeled "Select a section e.g. Safety" leads to an orange rectangle labeled "Query Generation".
5. **Perplexity Search API:** From the first "Query Generation" node, an arrow labeled "Search the internet for safety and its subsections for Claude Sonnet 4" leads to a blue rectangle labeled "Perplexity Search API". The Perplexity Search API node also has a logo of a purple geometric shape. Below this node, the text "Results in Chunks with sources" is present.
6. **Query Generation (2):** An arrow from "Perplexity Search API" leads to another orange rectangle labeled "Query Generation".
7. **LLM Nodes:** Three circles, arranged vertically, are labeled "LLM1" (green), "LLM2" (yellow), and "LLM3" (gray). These are enclosed in a light gray box.
8. **Scoring:** Arrows from both "Query Generation" nodes point to the LLM nodes. The arrow pointing to the LLM nodes is labeled "Score based on our new model card".
9. **Consensus:** Arrows from the LLM nodes lead to a purple rectangle labeled "Consensus: Majority vote".
10. **Populate the Framework:** An arrow from "Consensus" leads to a blue rectangle labeled "Populate the Framework".
11. **Loop:** A curved arrow from "Populate the Framework" leads back to the "Start" node, indicating a loop in the process.
### Key Observations
* The flowchart describes an iterative process for populating a model card framework.
* The process involves selecting a model, generating queries, searching the internet, scoring using LLMs, and reaching a consensus.
* The loop from "Populate the Framework" back to "Start" suggests continuous refinement and updating of the model card.
### Interpretation
The flowchart outlines a systematic approach to evaluating and documenting AI models using a model card framework. The process leverages external data sources (Perplexity Search API) and multiple LLMs to generate scores and reach a consensus on model characteristics, specifically safety. The iterative nature of the process allows for continuous improvement and refinement of the model card, ensuring it remains up-to-date and accurate. The use of a consensus mechanism suggests an effort to reduce bias and ensure a more objective evaluation of the models.