\n
## Bar Chart: R1-Llama | MATH500 - Content vs. Function Word Ratio
### Overview
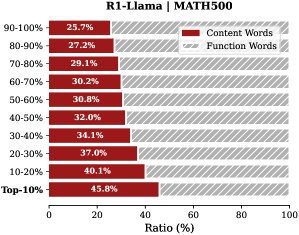
This is a horizontal bar chart displaying the ratio of content words to function words within different percentile ranges of a language model (R1-Llama) evaluated on a MATH500 dataset. The chart shows how the proportion of content words changes as you move from the most frequent words (Top 10%) to the least frequent words (90-100%).
### Components/Axes
* **Title:** R1-Llama | MATH500
* **X-axis:** Ratio (%) - Scale ranges from 0 to 100.
* **Y-axis:** Percentile Ranges - Categories are: Top 10%, 10-20%, 20-30%, 30-40%, 40-50%, 50-60%, 60-70%, 70-80%, 80-90%, 90-100%.
* **Legend:**
* Content Words: Represented by dark red bars.
* Function Words: Represented by light gray bars.
### Detailed Analysis
The chart consists of ten horizontal bars, each representing a percentile range. The length of the dark red bar indicates the ratio of content words for that range, while the light gray portion represents the ratio of function words.
Here's a breakdown of the data points:
* **Top 10%:** 45.8% Content Words
* **10-20%:** 40.1% Content Words
* **20-30%:** 37.0% Content Words
* **30-40%:** 34.1% Content Words
* **40-50%:** 32.0% Content Words
* **50-60%:** 30.8% Content Words
* **60-70%:** 30.2% Content Words
* **70-80%:** 29.1% Content Words
* **80-90%:** 27.2% Content Words
* **90-100%:** 25.7% Content Words
**Trend:** The ratio of content words decreases consistently as you move down the percentile ranges (from Top 10% to 90-100%). This indicates that less frequent words are more likely to be function words.
### Key Observations
* The most significant difference in content word ratio is between the Top 10% and the 90-100% range (a difference of approximately 20.1%).
* The decrease in content word ratio appears to be relatively linear across the percentile ranges.
* The function word ratio increases as the content word ratio decreases, maintaining a total of 100% for each percentile range.
### Interpretation
The data suggests that the R1-Llama model, when evaluated on the MATH500 dataset, exhibits a clear pattern in the distribution of content and function words. The most frequent words are predominantly content words (nouns, verbs, adjectives, etc.), while less frequent words are more likely to be function words (prepositions, articles, conjunctions, etc.). This is a common linguistic phenomenon, as function words are essential for grammatical structure but carry less semantic weight.
The consistent downward trend in content word ratio indicates that the model's vocabulary is structured in a way that reflects this linguistic principle. This could be due to the training data used to develop the model or inherent properties of the MATH500 dataset itself. The chart provides insight into the model's understanding and utilization of different word types, which could be relevant for tasks such as text generation, question answering, and language understanding.