## Histogram: Distribution of US Values for True and False Answers
### Overview
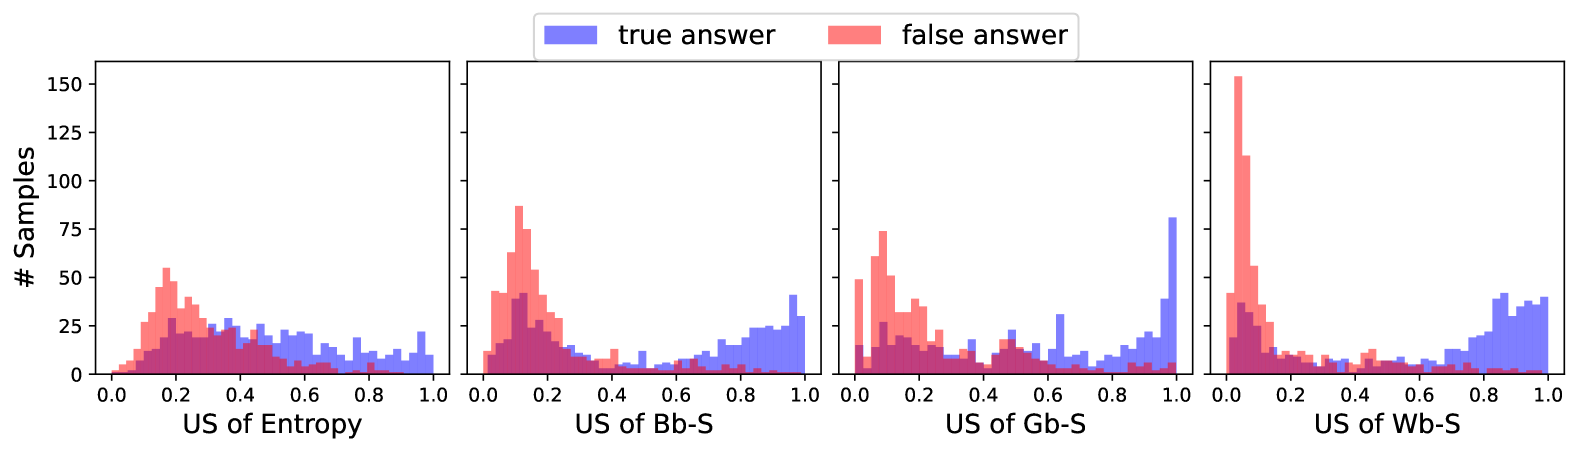
The image consists of four histograms displayed side-by-side. Each histogram shows the distribution of "US" values for "true answer" and "false answer" categories. The x-axis represents the "US" value, ranging from 0.0 to 1.0, and the y-axis represents the number of samples. The histograms are distinguished by different "US of" categories: Entropy, Bb-S, Gb-S, and Wb-S. The "true answer" data is represented in blue, and the "false answer" data is represented in red.
### Components/Axes
* **Y-axis:** "# Samples" ranging from 0 to 150, with increments of 25.
* **X-axis:** "US of [Category]" ranging from 0.0 to 1.0, with increments of 0.2.
* **Legend (Top):**
* Blue: "true answer"
* Red: "false answer"
* **Histograms (Left to Right):**
1. "US of Entropy"
2. "US of Bb-S"
3. "US of Gb-S"
4. "US of Wb-S"
### Detailed Analysis
**1. US of Entropy**
* **True Answer (Blue):** The distribution is bimodal. There is a peak around US = 0.5 with approximately 25 samples, and another peak near US = 0.9 with approximately 40 samples.
* **False Answer (Red):** The distribution is skewed to the left, with a peak around US = 0.1 with approximately 50 samples.
**2. US of Bb-S**
* **True Answer (Blue):** The distribution is bimodal. There is a peak around US = 0.8 with approximately 30 samples, and another peak near US = 1.0 with approximately 35 samples.
* **False Answer (Red):** The distribution is skewed to the left, with a peak around US = 0.1 with approximately 90 samples.
**3. US of Gb-S**
* **True Answer (Blue):** The distribution is skewed to the right, with a peak around US = 0.9 with approximately 30 samples.
* **False Answer (Red):** The distribution is skewed to the left, with a peak around US = 0.1 with approximately 100 samples.
**4. US of Wb-S**
* **True Answer (Blue):** The distribution is skewed to the right, with a peak around US = 0.9 with approximately 40 samples.
* **False Answer (Red):** The distribution is heavily skewed to the left, with a sharp peak around US = 0.1 with approximately 160 samples.
### Key Observations
* For "Entropy", the "true answer" distribution has two distinct peaks, while the "false answer" distribution is skewed towards lower US values.
* For "Bb-S", "Gb-S", and "Wb-S", the "false answer" distributions are heavily concentrated at low US values (around 0.1), while the "true answer" distributions are concentrated at high US values (around 0.8-1.0).
* The "Wb-S" histogram shows the most pronounced separation between "true answer" and "false answer" distributions.
### Interpretation
The histograms suggest that the "US" values for "Bb-S", "Gb-S", and "Wb-S" are good indicators of whether an answer is true or false. Low US values are strongly associated with false answers, while high US values are associated with true answers. The "Entropy" US value is less discriminatory, as the "true answer" distribution has significant overlap with the "false answer" distribution. The "Wb-S" metric appears to be the most effective at distinguishing between true and false answers, given the clear separation of the distributions. This information could be used to improve the accuracy of a system that predicts the correctness of answers based on these "US" values.