\n
## Histograms: Uncertainty Scores Distribution
### Overview
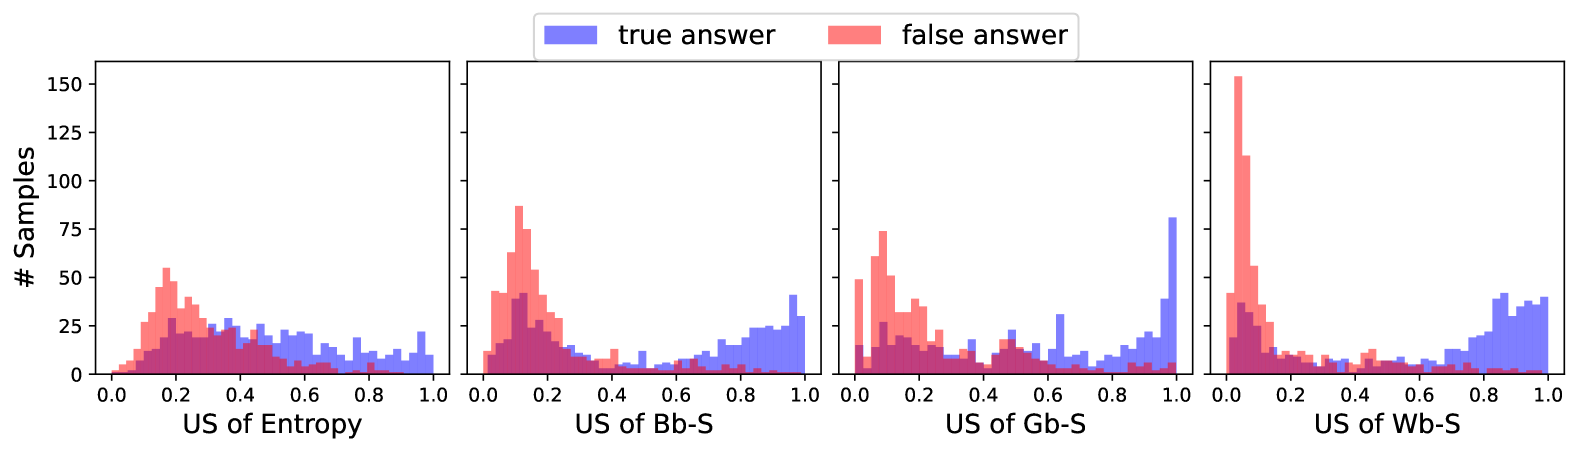
The image presents four histograms, each displaying the distribution of "Uncertainty Scores" (US) for different metrics: Entropy, Bb-S, Gb-S, and Wb-S. Each histogram differentiates between data points representing "true answers" (blue) and "false answers" (red). The y-axis represents the number of samples, while the x-axis represents the uncertainty score, ranging from 0.0 to 1.0.
### Components/Axes
* **X-axis Label (all histograms):** "US of [Metric Name]" where [Metric Name] is one of: Entropy, Bb-S, Gb-S, Wb-S. The scale ranges from 0.0 to 1.0.
* **Y-axis Label (all histograms):** "# Samples". The scale ranges from 0 to approximately 150.
* **Legend (top-left):**
* Blue: "true answer"
* Red: "false answer"
* **Histograms (four subplots):**
1. US of Entropy
2. US of Bb-S
3. US of Gb-S
4. US of Wb-S
### Detailed Analysis or Content Details
**1. US of Entropy:**
* **True Answer (Blue):** The distribution is bimodal, with a peak around 0.2 and a smaller peak around 0.8. The number of samples at 0.2 is approximately 20, and at 0.8 is approximately 10. The distribution generally decreases between these peaks.
* **False Answer (Red):** The distribution is unimodal, peaking sharply around 1.0. The maximum number of samples is approximately 130. The distribution rapidly declines as the US decreases.
**2. US of Bb-S:**
* **True Answer (Blue):** The distribution is relatively flat, with a slight increase towards the right side of the range (0.8-1.0). The number of samples is consistently around 10-15 across most of the range.
* **False Answer (Red):** The distribution is strongly peaked around 1.0, with approximately 100 samples. It declines rapidly towards 0.0.
**3. US of Gb-S:**
* **True Answer (Blue):** The distribution is bimodal, with peaks around 0.2 and 0.7. The peak at 0.2 is approximately 20 samples, and the peak at 0.7 is approximately 15 samples.
* **False Answer (Red):** The distribution is unimodal, peaking around 1.0 with approximately 80 samples. It declines rapidly towards 0.0.
**4. US of Wb-S:**
* **True Answer (Blue):** The distribution is relatively flat, with a slight increase towards the right side of the range (0.8-1.0). The number of samples is consistently around 15-30 across most of the range.
* **False Answer (Red):** The distribution is strongly peaked around 1.0, with approximately 100 samples. It declines rapidly towards 0.0.
### Key Observations
* For all metrics, the "false answer" distribution is heavily skewed towards higher uncertainty scores (closer to 1.0).
* The "true answer" distributions are more varied, often exhibiting bimodal or flatter shapes.
* Entropy and Gb-S show more pronounced bimodal distributions for "true answers" compared to Bb-S and Wb-S.
* The number of samples for "false answers" is consistently higher than for "true answers" across all metrics.
### Interpretation
The data suggests that higher uncertainty scores are strongly correlated with incorrect answers. The "false answer" distributions consistently peak near 1.0, indicating that the model is more uncertain when it provides an incorrect response. The "true answer" distributions, being more spread out, suggest that the model can be confident (high US) or less confident (low US) when providing correct answers.
The bimodal distributions observed for Entropy and Gb-S in "true answers" could indicate the presence of two distinct types of questions or scenarios where the model exhibits different levels of confidence. The flatter distributions for Bb-S and Wb-S might suggest that these metrics are less sensitive to the specific characteristics of the questions.
The consistently higher number of samples for "false answers" could indicate a bias in the dataset or a tendency for the model to generate more incorrect responses. Further investigation is needed to determine the cause of this imbalance. The data suggests that uncertainty scores can be a useful indicator of answer correctness, but they are not foolproof, as the model can sometimes be confident in incorrect answers.