## Histograms: Distribution of Uncertainty Scores (US) for True vs. False Answers
### Overview
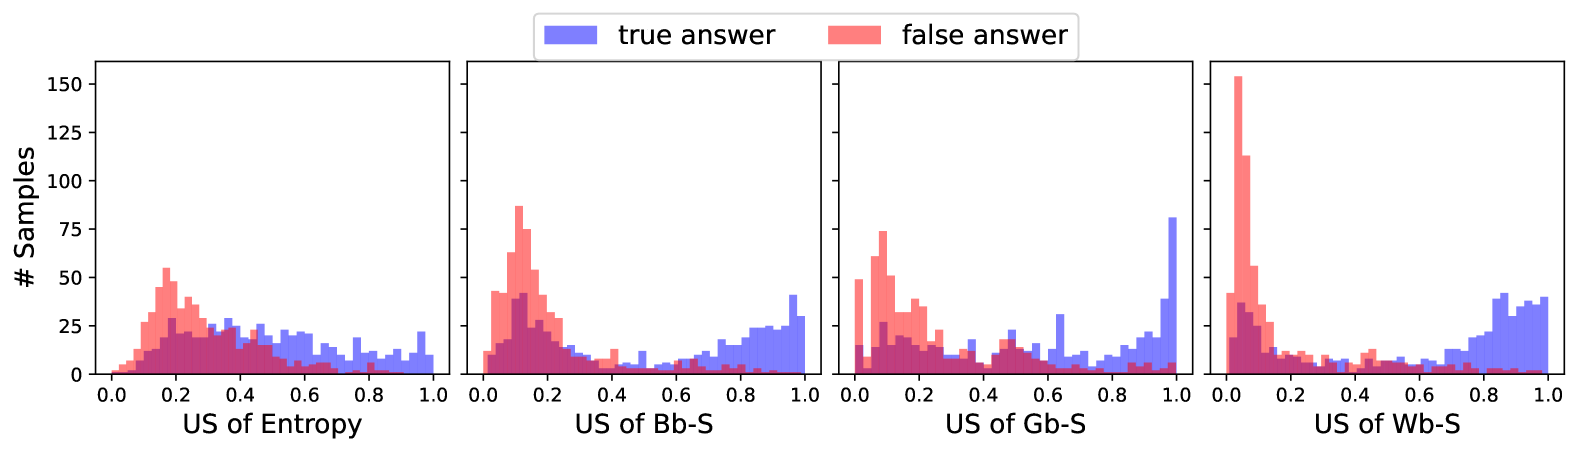
The image displays a set of four horizontally arranged histograms. Each histogram compares the frequency distribution of an uncertainty score (US) for two categories: "true answer" (blue) and "false answer" (red). The plots share a common y-axis representing the number of samples. The overall purpose is to visualize how the uncertainty score distributions differ between correct and incorrect answers across four distinct metrics.
### Components/Axes
* **Legend:** Located at the top center of the entire figure. It defines two categories:
* **true answer:** Represented by blue bars.
* **false answer:** Represented by red/salmon bars.
* Where the distributions overlap, the color appears as a dark purple/magenta.
* **Y-Axis (Common to all plots):**
* **Label:** "# Samples" (rotated vertically on the far left).
* **Scale:** Linear scale from 0 to 150, with major tick marks at 0, 25, 50, 75, 100, 125, and 150.
* **X-Axes (Individual for each subplot):** Each subplot has its own x-axis label and scale.
* **Scale:** All four x-axes are linear and range from 0.0 to 1.0, with major tick marks at 0.0, 0.2, 0.4, 0.6, 0.8, and 1.0.
* **Labels (from left to right):**
1. "US of Entropy"
2. "US of Bb-S"
3. "US of Gb-S"
4. "US of Wb-S"
### Detailed Analysis
**1. US of Entropy (Leftmost Plot):**
* **False Answer (Red):** Shows a unimodal distribution peaking between approximately 0.2 and 0.3. The peak frequency is around 50-55 samples. The distribution tapers off towards both 0.0 and 1.0.
* **True Answer (Blue):** Shows a broader, more uniform distribution across the entire range from 0.0 to 1.0. It has a slight concentration between 0.2 and 0.6, with frequencies generally between 15-30 samples. There is no single sharp peak.
* **Overlap:** Significant overlap occurs between 0.1 and 0.5, where both distributions have moderate frequency.
**2. US of Bb-S (Second Plot):**
* **False Answer (Red):** Exhibits a sharp, high peak near 0.1, reaching approximately 85-90 samples. The distribution is heavily right-skewed, with very few samples above 0.4.
* **True Answer (Blue):** Shows a bimodal or rising distribution. It has a small presence at low values but increases steadily from about 0.4, reaching its highest point (approximately 40 samples) near 1.0.
* **Overlap:** Minimal overlap. The distributions are largely separated, with false answers dominating the low-score region (<0.3) and true answers dominating the high-score region (>0.6).
**3. US of Gb-S (Third Plot):**
* **False Answer (Red):** Similar to Bb-S, it has a sharp peak near 0.1 (approx. 70-75 samples) and is right-skewed.
* **True Answer (Blue):** Shows a distinct, sharp peak at the extreme high end (1.0), reaching approximately 80 samples. There is also a smaller, secondary cluster of samples between 0.4 and 0.8.
* **Overlap:** Very limited overlap, primarily below 0.3. This metric shows the strongest separation, with a clear cluster of true answers at the maximum score.
**4. US of Wb-S (Rightmost Plot):**
* **False Answer (Red):** Has the highest peak of all plots, reaching over 150 samples (the y-axis limit) at a very low score near 0.05. The distribution is extremely right-skewed.
* **True Answer (Blue):** Shows a rising trend similar to Bb-S, with frequencies increasing from about 0.4 and peaking between 0.8 and 1.0 at around 40-45 samples.
* **Overlap:** Almost no overlap. The false answer distribution is almost entirely confined to scores below 0.2, while the true answer distribution is concentrated above 0.6.
### Key Observations
1. **Separation Trend:** The degree of separation between the "true" and "false" answer distributions increases from left to right. "US of Entropy" shows the most overlap, while "US of Wb-S" and "US of Gb-S" show the clearest separation.
2. **False Answer Behavior:** Across all metrics, false answers consistently cluster at lower uncertainty scores (typically < 0.3). The peak is sharpest and highest for "US of Wb-S".
3. **True Answer Behavior:** True answers show more varied behavior. For "Entropy," they are spread out. For "Bb-S" and "Wb-S," they trend toward higher scores. For "Gb-S," they show a strong, specific peak at the maximum score of 1.0.
4. **Metric Sensitivity:** "Gb-S" and "Wb-S" appear to be the most discriminative metrics, as they produce the clearest bimodal separation between the two answer types.
### Interpretation
This visualization suggests that the four uncertainty score (US) metrics have varying effectiveness in distinguishing between correct ("true") and incorrect ("false") answers from a model or system.
* **"US of Entropy"** is a poor discriminator. The broad, overlapping distributions indicate that entropy-based uncertainty does not strongly correlate with answer correctness in this dataset. A model could be equally uncertain (have similar entropy) whether it is right or wrong.
* **"US of Bb-S", "US of Gb-S", and "US of Wb-S"** are much more effective. They demonstrate a clear pattern: **incorrect answers are associated with low uncertainty scores, while correct answers are associated with high uncertainty scores.** This is a desirable property for an uncertainty metric, as it implies the model is "confident" (low US) when it is wrong and "uncertain" (high US) when it is right, which can be counter-intuitive but is a known phenomenon in some calibration studies. Alternatively, it may indicate these scores measure something like "confidence" rather than epistemic uncertainty, where high confidence (low score) correlates with errors.
* The **"Gb-S" metric** is particularly notable for its sharp peak of true answers at US=1.0, suggesting it may perfectly capture a state of maximum uncertainty or a specific model behavior for a subset of correct answers.
* **Practical Implication:** If the goal is to flag potential errors, using a threshold on "US of Wb-S" or "US of Gb-S" (e.g., flagging answers with US < 0.2) would be highly effective, as it would capture most false answers while rejecting very few true ones. The "US of Entropy" would be ineffective for this task.
**Language Note:** All text in the image is in English.