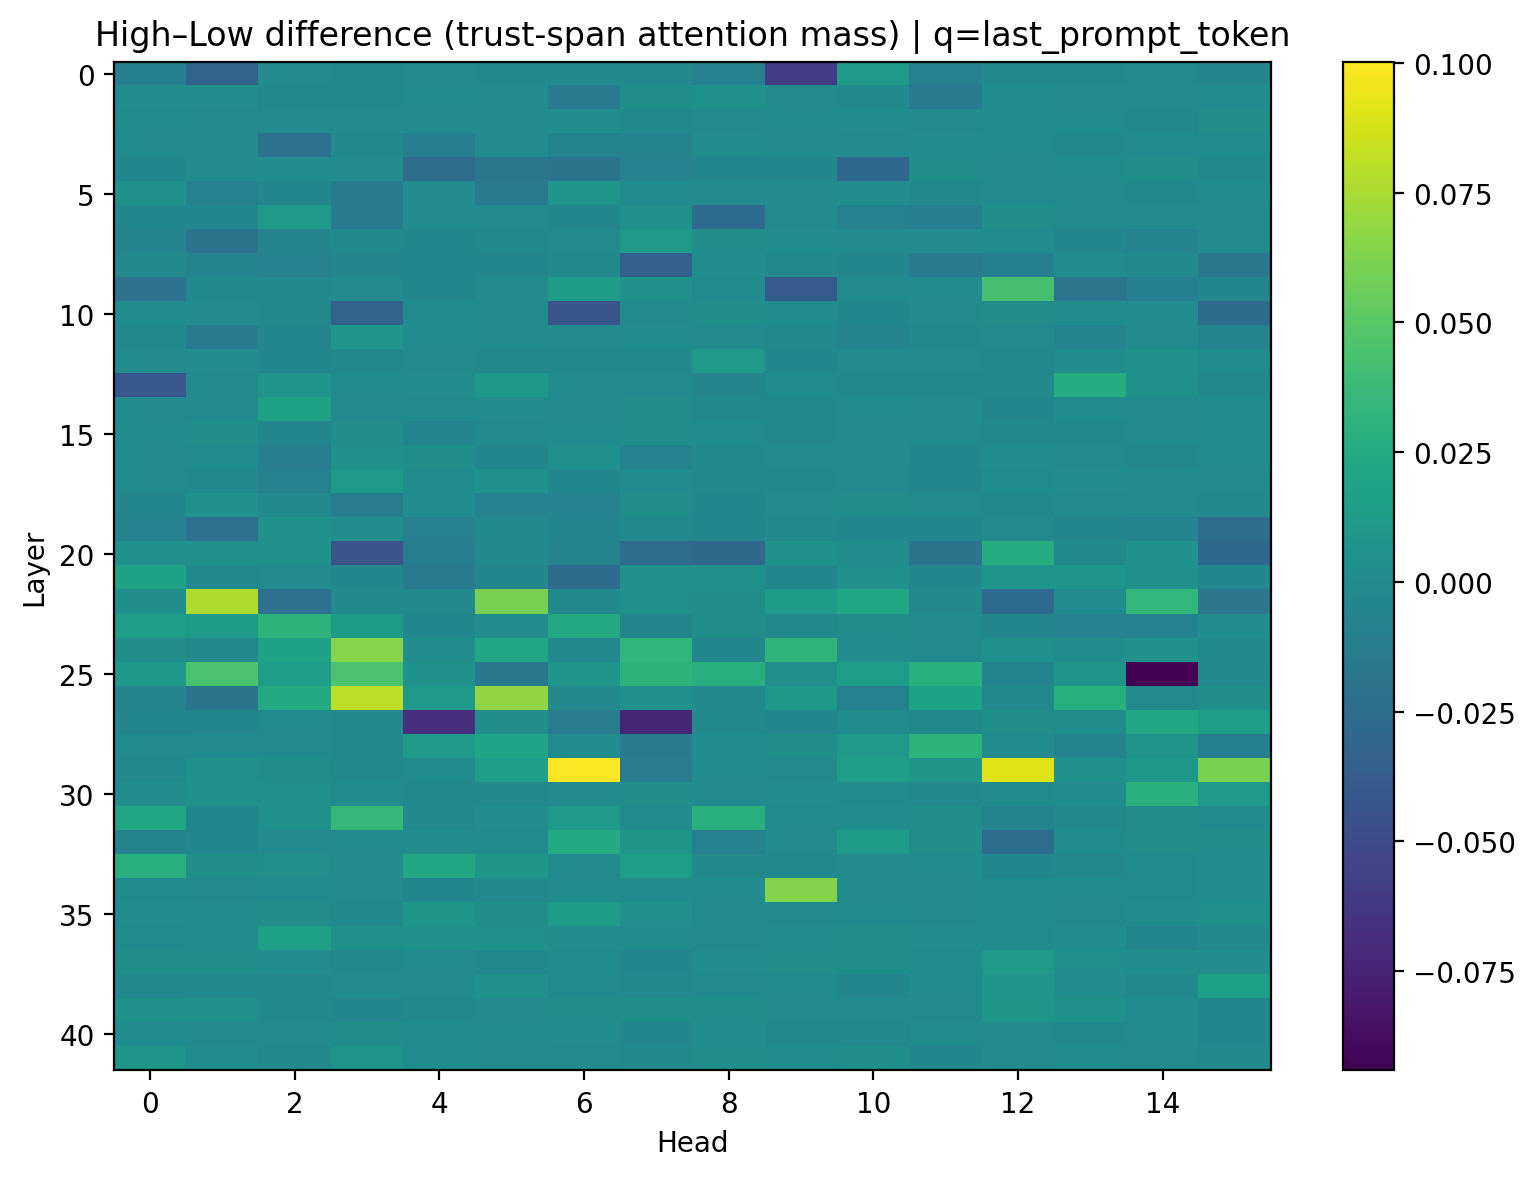
## Heatmap: High-Low difference (trust-span attention mass) | q=last_prompt_token
### Overview
The image is a heatmap visualizing the "High-Low difference" metric across neural network layers and attention heads. The color intensity represents the magnitude of differences, with a colorbar indicating values from -0.075 (purple) to +0.100 (yellow). The x-axis represents attention heads (0–14), and the y-axis represents layers (0–40).
### Components/Axes
- **X-axis (Head)**: Labeled "Head" with integer markers from 0 to 14.
- **Y-axis (Layer)**: Labeled "Layer" with integer markers from 0 to 40.
- **Colorbar**: Positioned on the right, ranging from -0.075 (purple) to +0.100 (yellow). Intermediate values include:
- -0.050 (dark blue)
- -0.025 (medium blue)
- 0.000 (cyan)
- 0.025 (light green)
- 0.050 (bright green)
- 0.075 (yellow-green)
- 0.100 (yellow)
### Detailed Analysis
- **Highest Positive Values (+0.075 to +0.100)**:
- Layer 25, Heads 1 and 9 (bright yellow).
- Layer 30, Head 9 (yellow-green).
- Layer 35, Head 9 (yellow-green).
- **Most Negative Values (-0.075)**:
- Layer 0, Head 0 (dark purple).
- Layer 35, Head 14 (dark purple).
- **Intermediate Values**:
- Most regions show cyan to medium blue shades (near 0.000 to -0.025).
- Layer 20, Head 6 (bright yellow-green, ~+0.075).
- Layer 25, Head 6 (bright yellow, ~+0.100).
### Key Observations
1. **Concentration of High Values**: Layers 25–35 and Heads 1, 6, 9 exhibit the strongest positive differences.
2. **Negative Outliers**: Layer 0 (Head 0) and Layer 35 (Head 14) show the most negative differences.
3. **Spatial Patterns**: Positive values cluster in mid-layers (20–35), while negative values dominate early (Layer 0) and late (Layer 35) layers.
### Interpretation
The heatmap suggests that attention mechanisms in mid-layers (20–35) exhibit significant variability in "High-Low difference" metrics, particularly in Heads 1, 6, and 9. The extreme negative values in Layer 0 (Head 0) and Layer 35 (Head 14) may indicate baseline or residual attention patterns. The clustering of high values in specific heads implies these components play a disproportionate role in modulating attention dynamics. The absence of values beyond ±0.100 suggests bounded differences, possibly due to normalization or architectural constraints.