## Flow Diagram: Multi-Level Decision Process
### Overview
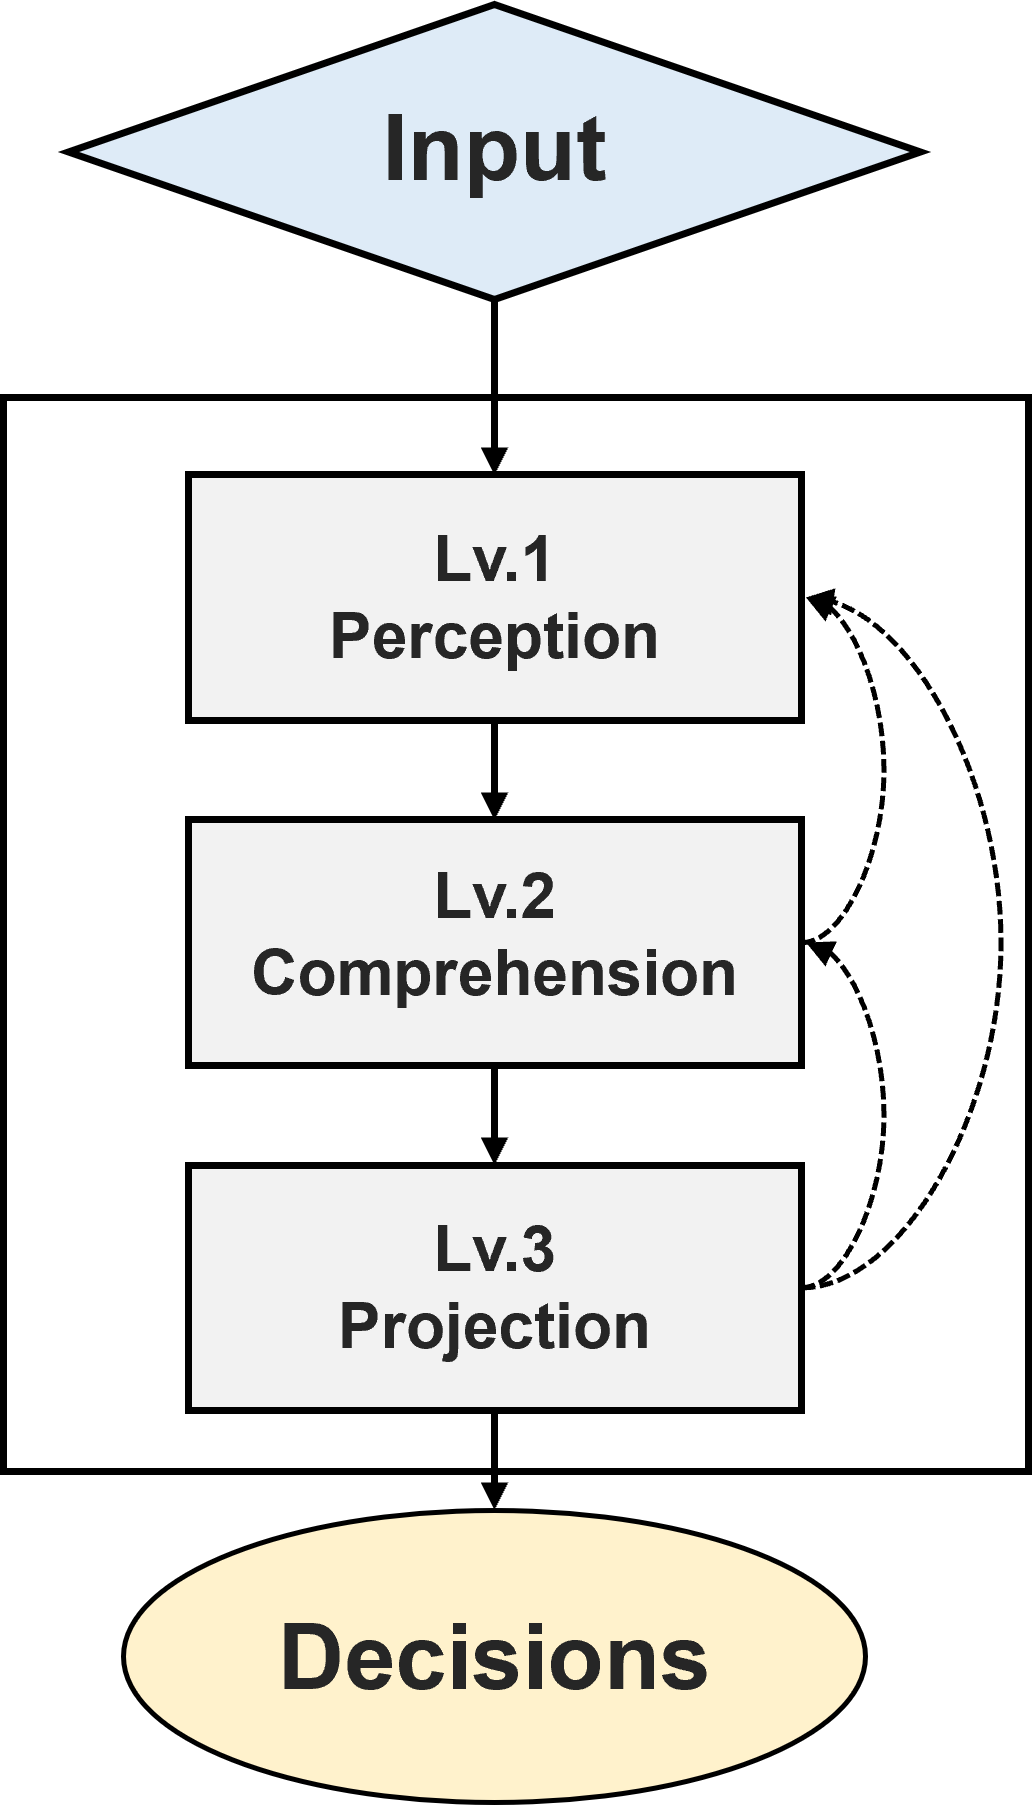
The image is a flow diagram illustrating a multi-level decision-making process. It starts with an "Input" and progresses through three levels: "Perception," "Comprehension," and "Projection," before arriving at "Decisions." Feedback loops are present from the "Projection" and "Comprehension" stages back to the "Perception" stage.
### Components/Axes
* **Shapes:** The diagram uses different shapes to represent different stages:
* Diamond: "Input" (top)
* Rectangle: "Lv.1 Perception," "Lv.2 Comprehension," "Lv.3 Projection" (middle)
* Oval: "Decisions" (bottom)
* **Arrows:** Solid arrows indicate the primary flow of the process. Dashed arrows indicate feedback loops.
* **Levels:** The process is divided into three levels, each represented by a rectangular box.
* **Background:** The levels are contained within a gray box.
### Detailed Analysis or ### Content Details
1. **Input:** A light blue diamond shape at the top contains the text "Input." A solid black arrow points downwards from the bottom of the diamond.
2. **Lv.1 Perception:** A black rectangle contains the text "Lv.1 Perception." A solid black arrow points downwards from the bottom of the rectangle.
3. **Lv.2 Comprehension:** A black rectangle contains the text "Lv.2 Comprehension." A solid black arrow points downwards from the bottom of the rectangle.
4. **Lv.3 Projection:** A black rectangle contains the text "Lv.3 Projection." A solid black arrow points downwards from the bottom of the rectangle.
5. **Decisions:** A yellow oval shape contains the text "Decisions."
6. **Feedback Loops:**
* A dashed black arrow originates from the right side of the "Lv.3 Projection" rectangle and curves back to the right side of the "Lv.1 Perception" rectangle.
* A dashed black arrow originates from the right side of the "Lv.2 Comprehension" rectangle and curves back to the right side of the "Lv.1 Perception" rectangle.
### Key Observations
* The diagram illustrates a sequential process with feedback loops.
* The levels represent different stages of understanding and processing information.
* The feedback loops suggest that the process is iterative, with later stages potentially influencing earlier stages.
### Interpretation
The diagram models a decision-making process where input is first perceived, then comprehended, and finally projected before a decision is made. The feedback loops from the projection and comprehension stages back to the perception stage suggest that the initial perception can be refined or altered based on later processing. This iterative process allows for adjustments and corrections in understanding, leading to more informed decisions. The model emphasizes the importance of perception, comprehension, and projection as distinct but interconnected stages in decision-making.