## Diagram: Cognitive Processing Flowchart
### Overview
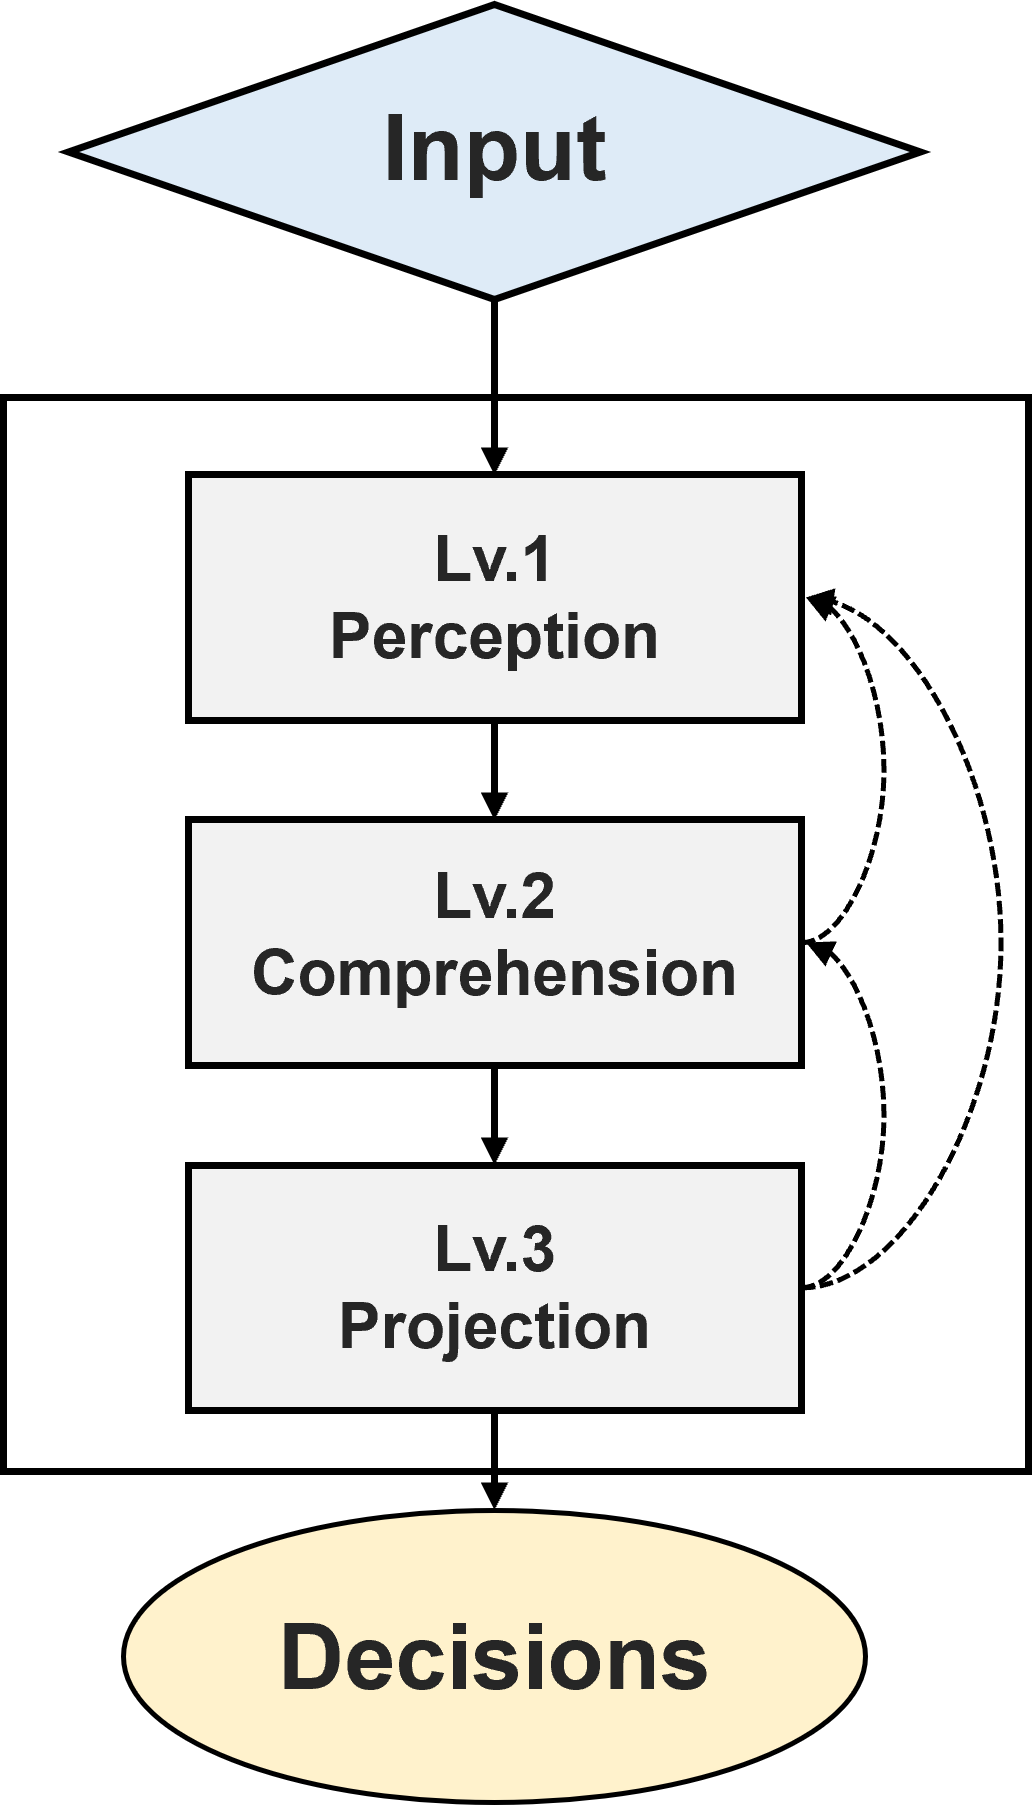
The image displays a vertical flowchart diagram illustrating a three-stage cognitive processing model. The flow begins with an input, passes through three hierarchical levels of processing contained within a central box, and results in decisions. The diagram uses standard flowchart symbols and includes feedback loops between the processing stages.
### Components/Axes
The diagram consists of the following components, listed from top to bottom:
1. **Input (Top):** A light blue diamond shape containing the text "**Input**". This represents the starting point or data source for the process.
2. **Processing Block (Center):** A large, light gray rectangle that encloses the three core processing levels. This block signifies the main cognitive processing system.
3. **Processing Levels (Inside Central Block):** Three white rectangles with black borders, arranged vertically and connected by solid black arrows indicating the primary flow.
* **Top Rectangle:** Contains the text "**Lv.1 Perception**".
* **Middle Rectangle:** Contains the text "**Lv.2 Comprehension**".
* **Bottom Rectangle:** Contains the text "**Lv.3 Projection**".
4. **Decisions (Bottom):** A light yellow oval shape containing the text "**Decisions**". This represents the output or outcome of the processing.
5. **Flow Arrows:**
* **Primary Flow:** Solid black arrows point downward from "Input" to "Lv.1 Perception", from "Lv.1" to "Lv.2", from "Lv.2" to "Lv.3", and from "Lv.3" to "Decisions".
* **Feedback Loops:** Two dashed, curved black arrows on the right side of the processing block indicate feedback or iterative relationships.
* One dashed arrow curves from the right side of the "Lv.3 Projection" box back up to the right side of the "Lv.2 Comprehension" box.
* Another dashed arrow curves from the right side of the "Lv.2 Comprehension" box back up to the right side of the "Lv.1 Perception" box.
### Detailed Analysis
The diagram models a sequential, hierarchical cognitive process with integrated feedback mechanisms.
* **Spatial Grounding:** The "Input" diamond is centered at the top. The central processing block occupies the majority of the image's vertical space. The three level boxes are centered within this block, stacked vertically. The "Decisions" oval is centered at the bottom. The feedback loops are positioned on the right-hand side of the central block.
* **Component Isolation & Flow:**
* **Header (Input):** The process is initiated by an external "Input".
* **Main Chart (Processing Block):** The core processing is segmented into three distinct, ordered levels:
1. **Lv.1 Perception:** The first stage, likely involving the detection and registration of sensory data from the input.
2. **Lv.2 Comprehension:** The second stage, suggesting the interpretation, understanding, or synthesis of the perceived information.
3. **Lv.3 Projection:** The third stage, implying the forecasting, planning, or simulation of future states or outcomes based on the comprehended information.
* **Footer (Decisions):** The final output of the three-level processing is the generation of "Decisions".
* **Relationships:** The solid arrows define a strict top-down, feed-forward sequence. The dashed feedback arrows introduce non-linear dynamics, suggesting that higher-level processing (Projection, Comprehension) can inform and potentially refine the operations of lower-level stages (Comprehension, Perception). This creates a system capable of iterative refinement.
### Key Observations
1. **Hierarchical Structure:** The model is explicitly layered, with each level (Lv.1, Lv.2, Lv.3) building upon the output of the previous one.
2. **Hybrid Flow:** The diagram combines a linear, sequential pipeline (solid arrows) with recursive feedback loops (dashed arrows), indicating a complex system that is both feed-forward and adaptive.
3. **Symbol Conventions:** It uses standard flowchart symbols: a diamond for a decision/start point (here, "Input"), rectangles for processes, and an oval for a terminal point ("Decisions").
4. **Encapsulation:** The three processing levels are grouped within a single bounding box, visually defining them as the core, integrated components of the cognitive system.
### Interpretation
This flowchart represents a model of **cognitive or decision-making architecture**. It suggests that turning raw input into actionable decisions is not a simple, one-pass process but involves three fundamental, escalating stages of information processing:
1. **Perception** is the foundational stage of sensing the world.
2. **Comprehension** builds meaning from those sensations.
3. **Projection** uses that meaning to anticipate possibilities.
The critical insight is the inclusion of **feedback loops**. These imply that the system is not merely reactive. The ability to project future states (Lv.3) can alter how we understand current information (Lv.2), and that refined understanding can, in turn, sharpen our initial perceptions (Lv.1). This models learning, hypothesis testing, and strategic thinking, where outcomes and predictions continuously refine the system's own operation. The final output, "Decisions," is therefore the product of a dynamic, self-correcting cognitive cycle rather than a static calculation. This type of model is relevant in fields like artificial intelligence, cognitive science, systems engineering, and strategic planning.