## Flowchart: Decision-Making Process
### Overview
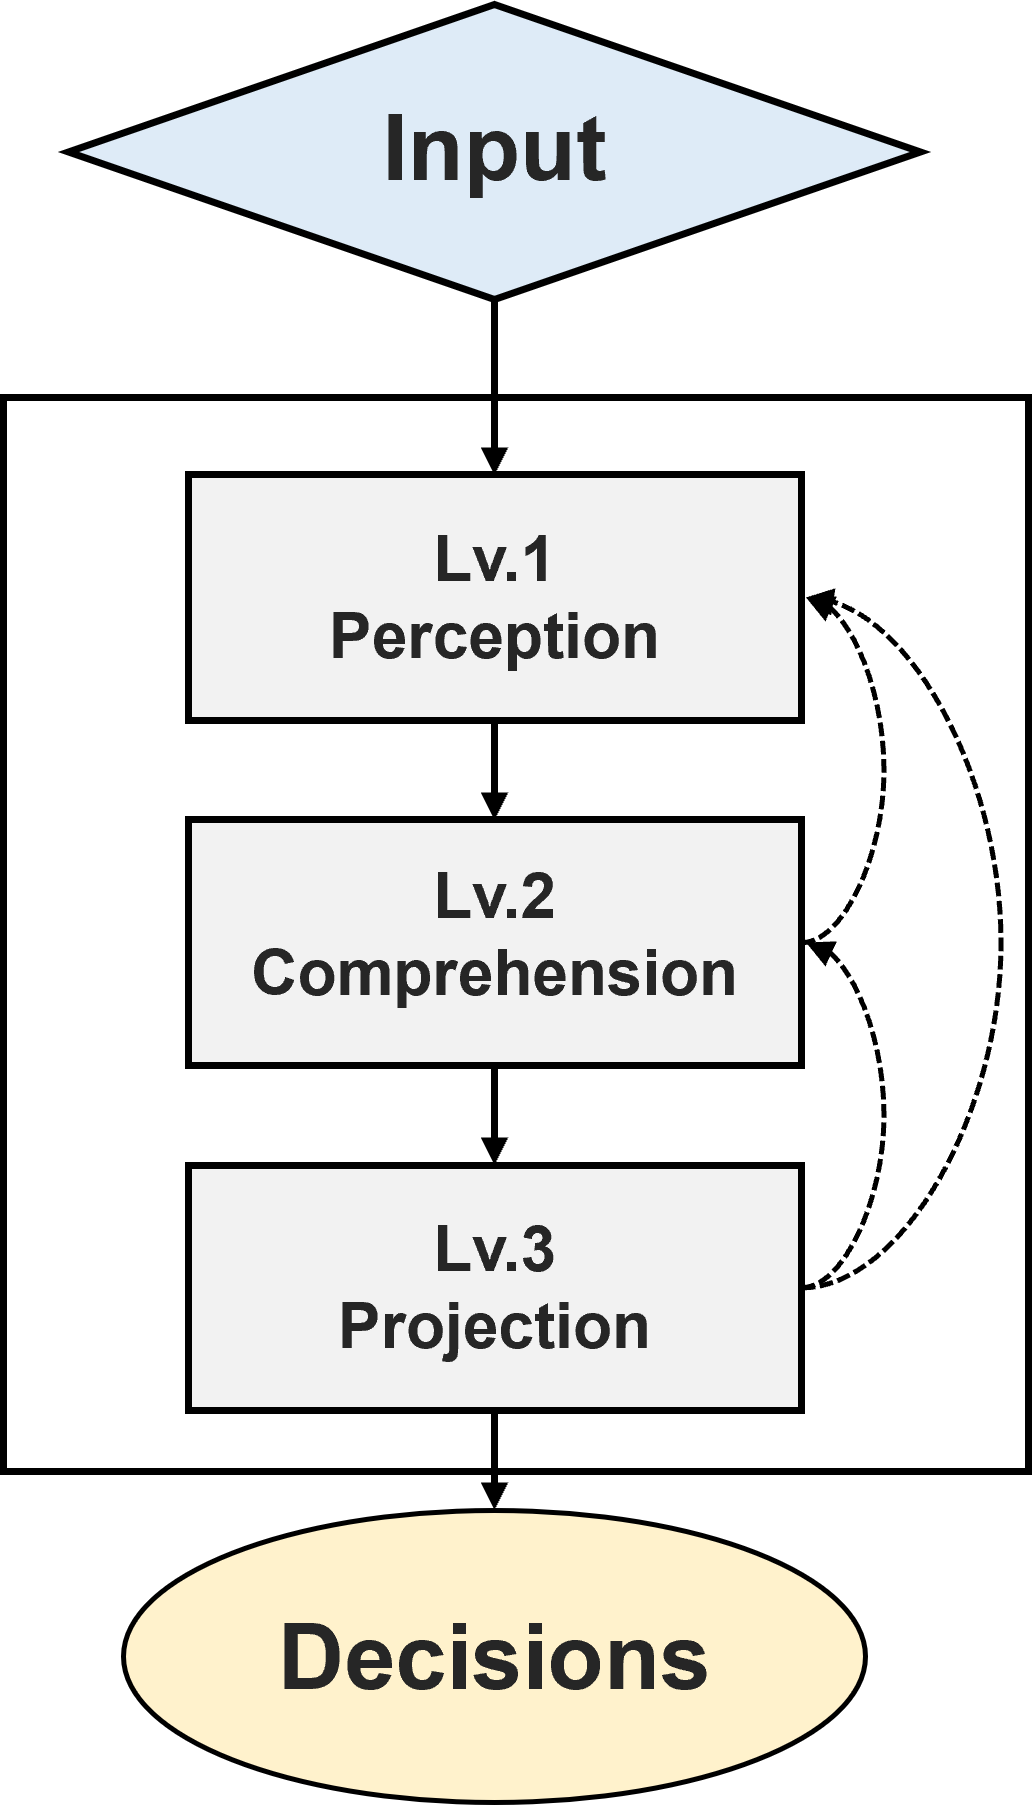
The image depicts a hierarchical decision-making process structured as a flowchart. It begins with an "Input" diamond shape at the top, followed by three sequential rectangular stages labeled "Lv.1 Perception," "Lv.2 Comprehension," and "Lv.3 Projection." These stages are connected by solid arrows, with additional dashed arrows indicating feedback loops. The process concludes with an oval labeled "Decisions" at the bottom.
### Components/Axes
- **Input**: Diamond-shaped node at the top, serving as the starting point.
- **Lv.1 Perception**: First rectangular stage, directly connected to Input via a solid arrow.
- **Lv.2 Comprehension**: Second rectangular stage, connected to Lv.1 via a solid arrow. Includes two dashed arrows looping back to Lv.3 Projection.
- **Lv.3 Projection**: Third rectangular stage, connected to Lv.2 via a solid arrow and receiving feedback from Lv.2 via dashed arrows.
- **Decisions**: Oval-shaped endpoint at the bottom, connected to Lv.3 via a solid arrow.
### Detailed Analysis
- **Flow Direction**:
- Solid arrows indicate sequential progression: Input → Lv.1 → Lv.2 → Lv.3 → Decisions.
- Dashed arrows from Lv.2 Comprehension to Lv.3 Projection suggest iterative refinement or feedback integration.
- **Node Placement**:
- Input: Top-center position.
- Lv.1, Lv.2, Lv.3: Vertically stacked rectangles with decreasing width.
- Decisions: Bottom-center oval, visually anchoring the process conclusion.
- **Dashed Arrows**: Positioned to the right of the main flow, emphasizing non-linear feedback.
### Key Observations
1. **Feedback Mechanism**: The dashed arrows from Lv.2 to Lv.3 imply that comprehension influences projection iteratively, rather than in a single pass.
2. **Hierarchical Structure**: The narrowing width of rectangles from Lv.1 to Lv.3 suggests increasing specificity or focus at each stage.
3. **Decision Finality**: The oval shape of the "Decisions" node contrasts with rectangular stages, symbolizing a definitive outcome.
### Interpretation
This flowchart models a cognitive or organizational decision-making process where:
- **Input** represents raw data or stimuli.
- **Perception** involves initial interpretation of inputs.
- **Comprehension** integrates perceived information, with feedback loops to refine projections.
- **Projection** generates potential outcomes based on comprehension.
- **Decisions** finalize choices after iterative refinement.
The feedback loop between Lv.2 and Lv.3 highlights the importance of revisiting assumptions or interpretations to improve decision quality. The absence of numerical data suggests this is a conceptual model rather than a quantitative analysis. The process emphasizes adaptability, as comprehension can retroactively adjust projections before decisions are made.