## Line Charts: Layer-wise ΔP for Llama-3 Models
### Overview
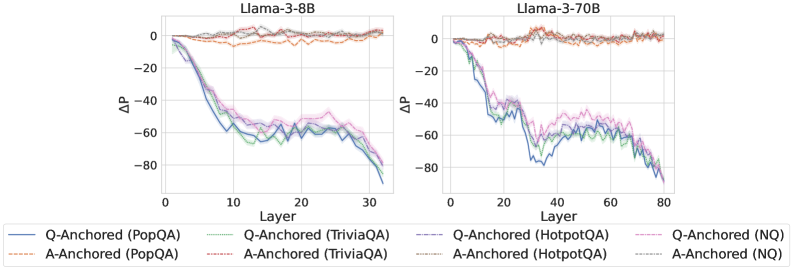
The image displays two side-by-side line charts comparing the change in probability (ΔP) across neural network layers for two different model sizes: Llama-3-8B (left) and Llama-3-70B (right). The charts analyze the performance of two anchoring methods (Q-Anchored and A-Anchored) across four different question-answering datasets.
### Components/Axes
* **Titles:**
* Left Chart: "Llama-3-8B"
* Right Chart: "Llama-3-70B"
* **Y-Axis (Both Charts):** Label is "ΔP". Scale ranges from -80 to 0, with major tick marks at intervals of 20 (-80, -60, -40, -20, 0).
* **X-Axis (Left Chart - Llama-3-8B):** Label is "Layer". Scale ranges from 0 to 30, with major tick marks at 0, 10, 20, 30.
* **X-Axis (Right Chart - Llama-3-70B):** Label is "Layer". Scale ranges from 0 to 80, with major tick marks at 0, 20, 40, 60, 80.
* **Legend (Bottom Center):** Contains 8 entries, differentiating lines by color and style (solid vs. dashed).
* **Q-Anchored (Solid Lines):**
* Blue: Q-Anchored (PopQA)
* Green: Q-Anchored (TriviaQA)
* Purple: Q-Anchored (HotpotQA)
* Pink: Q-Anchored (NQ)
* **A-Anchored (Dashed Lines):**
* Orange: A-Anchored (PopQA)
* Red: A-Anchored (TriviaQA)
* Gray: A-Anchored (HotpotQA)
* Brown: A-Anchored (NQ)
### Detailed Analysis
**Llama-3-8B Chart (Left):**
* **Q-Anchored Lines (Solid):** All four solid lines (Blue, Green, Purple, Pink) exhibit a strong, consistent downward trend. They start near ΔP = 0 at Layer 0 and decline steeply, converging in a cluster between approximately -60 and -80 by Layer 30. The lines are tightly grouped, with the Pink line (NQ) appearing slightly higher (less negative) than the others in the mid-layers (10-20).
* **A-Anchored Lines (Dashed):** All four dashed lines (Orange, Red, Gray, Brown) remain relatively flat and close to ΔP = 0 across all layers (0-30). They show minor fluctuations but no significant downward or upward trend, staying within a narrow band roughly between -10 and +5.
**Llama-3-70B Chart (Right):**
* **Q-Anchored Lines (Solid):** The same four solid lines show a similar downward trend but over a longer layer span. They start near 0 and decline to a cluster between -60 and -80 by Layer 80. The decline is less steep per layer compared to the 8B model. The Purple line (HotpotQA) appears to have the most pronounced dip around Layer 40 before recovering slightly.
* **A-Anchored Lines (Dashed):** Consistent with the 8B model, the dashed lines remain stable near ΔP = 0 across all 80 layers, with minor noise.
### Key Observations
1. **Anchoring Method Dichotomy:** There is a stark and consistent contrast between the two anchoring methods across both model sizes and all four datasets. Q-Anchored performance (ΔP) degrades significantly with depth, while A-Anchored performance remains stable.
2. **Model Size Effect:** The trend for Q-Anchored lines is similar in shape but stretched across more layers in the larger (70B) model. The final ΔP values at the deepest layers are comparable (~ -80), but the rate of decline is slower in the 70B model.
3. **Dataset Similarity:** Within each anchoring group (Q or A), the lines for different datasets (PopQA, TriviaQA, HotpotQA, NQ) follow very similar trajectories, suggesting the observed phenomenon is robust across these QA benchmarks.
4. **Spatial Layout:** The legend is positioned centrally below both charts, allowing for direct cross-referencing. The charts share the same y-axis scale and label, facilitating direct comparison of the ΔP magnitude.
### Interpretation
The data suggests a fundamental difference in how information is processed or retained across layers depending on the anchoring method. "ΔP" likely represents a change in probability or performance metric relative to a baseline.
* **Q-Anchored (Question-Anchored):** The consistent negative trend indicates that as information propagates through deeper layers of the model, the probability or confidence associated with the question-anchored representation diminishes significantly. This could imply that deeper layers are less effective at maintaining or utilizing the initial question context, or that the representation becomes "diluted."
* **A-Anchored (Answer-Anchored):** The stability near zero suggests that the answer-anchored representation is robustly maintained throughout the network's depth. The model's processing does not degrade the answer-related signal as it moves through the layers.
The contrast between the 8B and 70B models for the Q-Anchored lines is particularly insightful. The more gradual decline in the larger model might indicate that increased model capacity allows for a better preservation of the question-anchored signal across a deeper architecture, even if the ultimate degradation at the final layer is similar. This visualization provides strong evidence that the choice of anchoring (question vs. answer) has a profound and systematic impact on internal model dynamics across layers.