## Line Graphs: Performance Comparison of Q-Anchored and A-Anchored Methods in LLaMA-3 Models
### Overview
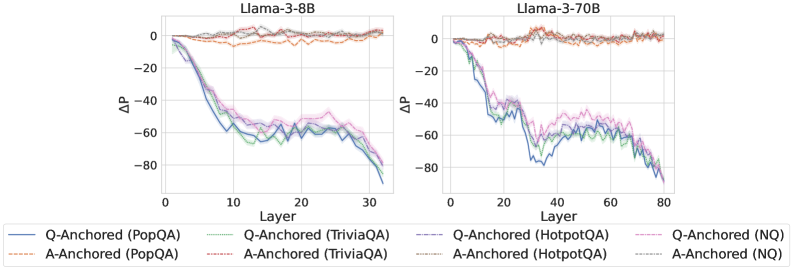
The image contains two side-by-side line graphs comparing the performance degradation (ΔP) of Q-Anchored and A-Anchored methods across different layers in LLaMA-3-8B and LLaMA-3-70B models. The graphs visualize how performance changes (ΔP) vary with model depth for four question-answering datasets: PopQA, TriviaQA, HotpotQA, and NQ. Each line represents a specific anchoring method and dataset combination.
### Components/Axes
- **X-axis (Layer)**: Model depth, ranging from 0 to 30 for LLaMA-3-8B and 0 to 80 for LLaMA-3-70B.
- **Y-axis (ΔP)**: Performance change, measured in arbitrary units (range: -80 to 0).
- **Legends**:
- **LLaMA-3-8B** (left graph):
- Solid blue: Q-Anchored (PopQA)
- Dashed orange: A-Anchored (PopQA)
- Solid green: Q-Anchored (TriviaQA)
- Dashed red: A-Anchored (TriviaQA)
- Solid purple: Q-Anchored (HotpotQA)
- Dashed pink: A-Anchored (HotpotQA)
- Solid gray: Q-Anchored (NQ)
- Dashed brown: A-Anchored (NQ)
- **LLaMA-3-70B** (right graph):
- Same color/style coding as above, with lines extending to layer 80.
### Detailed Analysis
#### LLaMA-3-8B (Left Graph)
- **Q-Anchored (PopQA)**: Starts at 0, slopes downward sharply to ~-80 by layer 30 (peak ΔP: -80).
- **A-Anchored (PopQA)**: Remains near 0 with minor fluctuations (ΔP: -2 to 0).
- **Q-Anchored (TriviaQA)**: Drops to ~-60 by layer 30 (ΔP: -60).
- **A-Anchored (TriviaQA)**: Stable near 0 (ΔP: -1 to 0).
- **Q-Anchored (HotpotQA)**: Declines to ~-70 (ΔP: -70).
- **A-Anchored (HotpotQA)**: Stable near 0 (ΔP: -2 to 0).
- **Q-Anchored (NQ)**: Plummets to ~-85 (ΔP: -85).
- **A-Anchored (NQ)**: Stable near 0 (ΔP: -1 to 0).
#### LLaMA-3-70B (Right Graph)
- **Q-Anchored (PopQA)**: Starts at 0, dips to ~-60 by layer 40, then stabilizes (ΔP: -60).
- **A-Anchored (PopQA)**: Fluctuates slightly above 0 (ΔP: -1 to 2).
- **Q-Anchored (TriviaQA)**: Drops to ~-50 by layer 60 (ΔP: -50).
- **A-Anchored (TriviaQA)**: Stable near 0 (ΔP: -1 to 1).
- **Q-Anchored (HotpotQA)**: Declines to ~-75 by layer 80 (ΔP: -75).
- **A-Anchored (HotpotQA)**: Stable near 0 (ΔP: -1 to 1).
- **Q-Anchored (NQ)**: Plummets to ~-90 by layer 80 (ΔP: -90).
- **A-Anchored (NQ)**: Stable near 0 (ΔP: -1 to 1).
### Key Observations
1. **Performance Degradation**: Q-Anchored methods show significant performance drops (ΔP) across all datasets, while A-Anchored methods remain stable (ΔP ≈ 0).
2. **Model Size Impact**: LLaMA-3-70B exhibits more gradual degradation than LLaMA-3-8B, suggesting larger models handle anchoring better.
3. **Dataset Variability**: NQ (Natural Questions) shows the steepest decline for Q-Anchored methods, indicating higher sensitivity to anchoring choices.
4. **Layer Stability**: A-Anchored methods maintain near-zero ΔP across all layers, while Q-Anchored methods degrade sharply in early layers.
### Interpretation
The data demonstrates that **A-Anchored methods preserve performance stability** across model layers, whereas **Q-Anchored methods degrade significantly**, especially in smaller models (LLaMA-3-8B). The larger LLaMA-3-70B model mitigates this degradation but does not eliminate it. The NQ dataset’s extreme sensitivity to anchoring suggests it poses unique challenges for Q-Anchored approaches. These trends highlight the importance of anchoring strategy in maintaining model performance during scaling.