## Bar Chart: Model Accuracy Comparison
### Overview
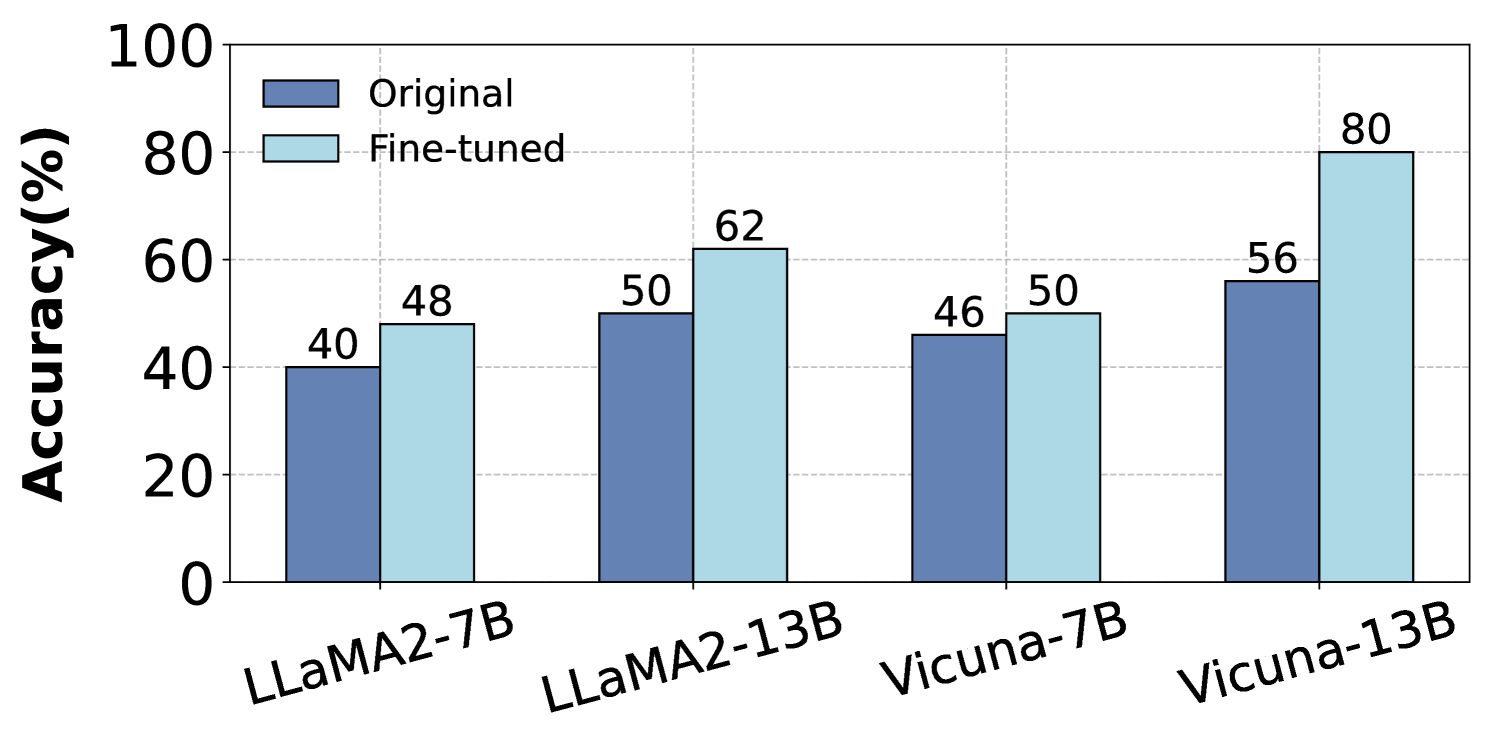
The image is a bar chart comparing the accuracy of different language models, both in their original state and after fine-tuning. The chart displays the accuracy (in percentage) on the y-axis and the model names on the x-axis. Two bars are shown for each model: one representing the original accuracy (dark blue) and the other representing the fine-tuned accuracy (light blue).
### Components/Axes
* **Y-axis:** "Accuracy(%)", ranging from 0 to 100, with gridlines at intervals of 20.
* **X-axis:** Categorical axis representing the language models: LLaMA2-7B, LLaMA2-13B, Vicuna-7B, and Vicuna-13B.
* **Legend:** Located at the top-left of the chart.
* Dark blue bar: "Original"
* Light blue bar: "Fine-tuned"
### Detailed Analysis
The chart presents accuracy data for four language models, comparing their original and fine-tuned performance.
* **LLaMA2-7B:**
* Original accuracy: 40%
* Fine-tuned accuracy: 48%
* **LLaMA2-13B:**
* Original accuracy: 50%
* Fine-tuned accuracy: 62%
* **Vicuna-7B:**
* Original accuracy: 46%
* Fine-tuned accuracy: 50%
* **Vicuna-13B:**
* Original accuracy: 56%
* Fine-tuned accuracy: 80%
### Key Observations
* Fine-tuning consistently improves the accuracy of all models.
* The Vicuna-13B model shows the most significant improvement after fine-tuning, increasing from 56% to 80%.
* The LLaMA2-7B model shows the smallest improvement after fine-tuning, increasing from 40% to 48%.
### Interpretation
The bar chart demonstrates the impact of fine-tuning on the accuracy of different language models. The data suggests that fine-tuning is an effective technique for improving model performance. The extent of improvement varies across models, with Vicuna-13B showing the most substantial gain. This could be due to the model's architecture, the fine-tuning dataset, or other factors. The consistent improvement across all models indicates that fine-tuning is a generally beneficial strategy.