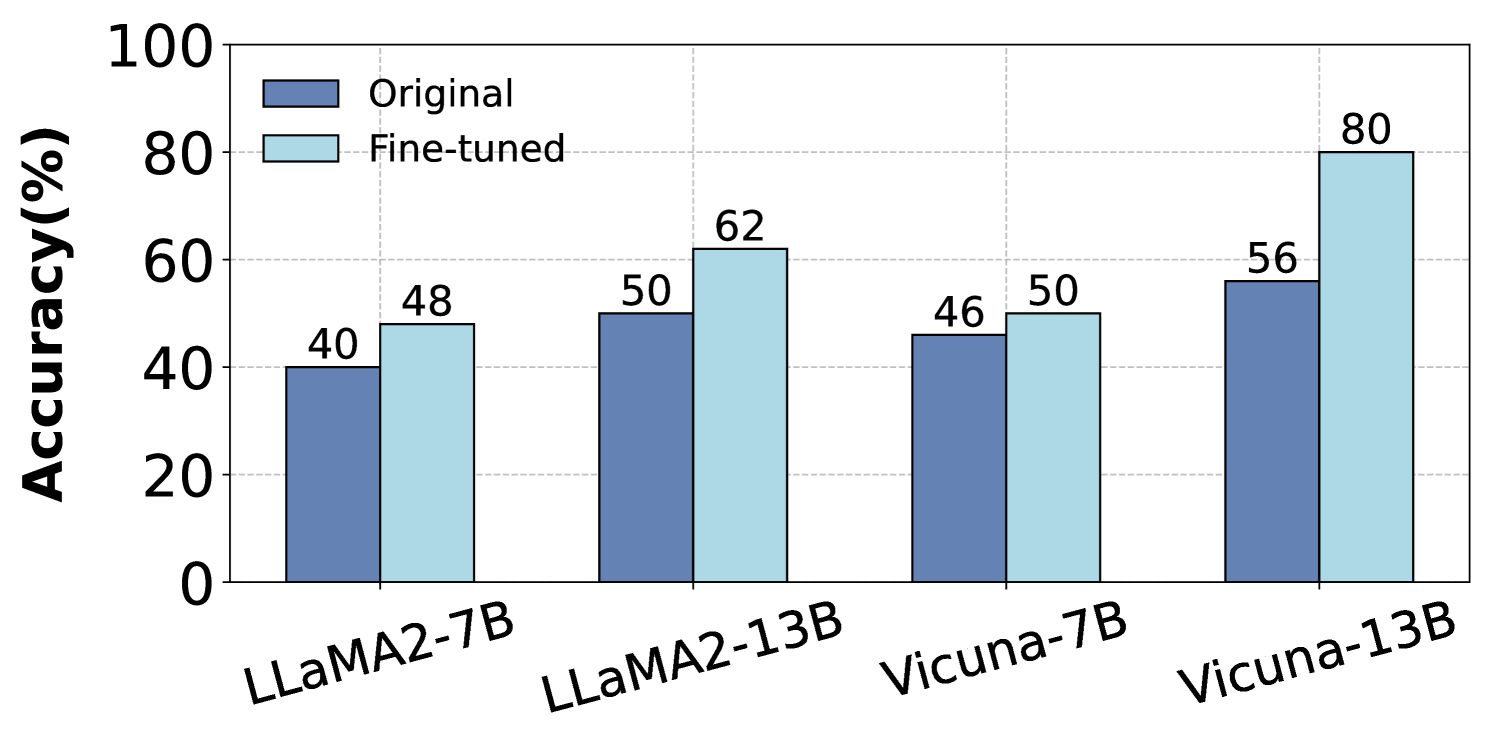
## Bar Chart: Model Accuracy Comparison (Original vs. Fine-tuned)
### Overview
The chart compares the accuracy percentages of four language models (LLaMA2-7B, LLaMA2-13B, Vicuna-7B, Vicuna-13B) in their original and fine-tuned states. Accuracy is measured on a 0-100% scale, with fine-tuned versions consistently outperforming original versions.
### Components/Axes
- **X-axis**: Model architectures (LLaMA2-7B, LLaMA2-13B, Vicuna-7B, Vicuna-13B)
- **Y-axis**: Accuracy (%) from 0 to 100
- **Legend**:
- Dark blue = Original
- Light blue = Fine-tuned
- **Bar Colors**:
- Original models: Dark blue
- Fine-tuned models: Light blue
### Detailed Analysis
1. **LLaMA2-7B**:
- Original: 40%
- Fine-tuned: 48% (↑8%)
2. **LLaMA2-13B**:
- Original: 50%
- Fine-tuned: 62% (↑12%)
3. **Vicuna-7B**:
- Original: 46%
- Fine-tuned: 50% (↑4%)
4. **Vicuna-13B**:
- Original: 56%
- Fine-tuned: 80% (↑24%)
### Key Observations
- **Universal Improvement**: All models show higher accuracy after fine-tuning.
- **Scale Dependency**: Larger models (13B) demonstrate greater improvement:
- LLaMA2-13B: +12% (vs. +8% for 7B)
- Vicuna-13B: +24% (vs. +4% for 7B)
- **Vicuna-13B Outlier**: Largest absolute improvement (+24%) and highest final accuracy (80%).
### Interpretation
The data demonstrates that fine-tuning significantly enhances model performance across all architectures, with larger models (13B) benefiting disproportionately. The 24% improvement in Vicuna-13B suggests architectural or training differences that make it particularly responsive to fine-tuning. This pattern implies that model size and design play critical roles in fine-tuning efficacy, with potential implications for resource allocation in NLP development.