## Bar Chart: Project CodeNet Dataset Success Rate vs. GPT-4o Model Temperature
### Overview
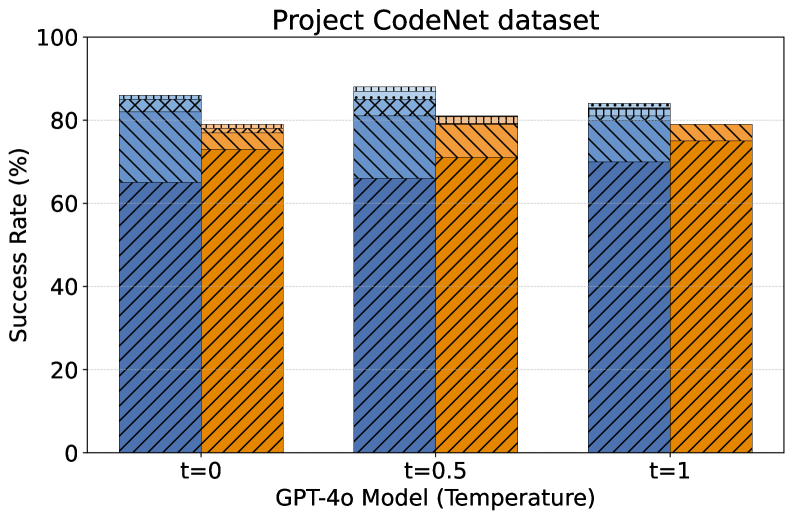
The image is a bar chart comparing the success rate of a model (GPT-4o) on the Project CodeNet dataset at different temperature settings (t=0, t=0.5, t=1). The chart displays two bars for each temperature setting, with the blue bar representing one condition and the orange bar representing another. The y-axis represents the success rate in percentage, ranging from 0% to 100%.
### Components/Axes
* **Title:** Project CodeNet dataset
* **X-axis:** GPT-4o Model (Temperature) with labels t=0, t=0.5, t=1
* **Y-axis:** Success Rate (%) with scale markers at 0, 20, 40, 60, 80, and 100.
* **Bars:**
* Blue bars with diagonal lines sloping upwards to the right.
* Orange bars with diagonal lines sloping upwards to the right.
* The bars are grouped by temperature setting (t=0, t=0.5, t=1).
* Each bar is divided into two sections, a larger section with diagonal lines, and a smaller section on top with a cross-hatched pattern.
### Detailed Analysis
The chart presents success rates for two conditions (represented by blue and orange bars) across three temperature settings (t=0, t=0.5, t=1).
* **At t=0:**
* The blue bar reaches approximately 86%. The lower section of the blue bar reaches approximately 66%. The upper cross-hatched section is approximately 20%.
* The orange bar reaches approximately 79%. The lower section of the orange bar reaches approximately 74%. The upper cross-hatched section is approximately 5%.
* **At t=0.5:**
* The blue bar reaches approximately 88%. The lower section of the blue bar reaches approximately 68%. The upper cross-hatched section is approximately 20%.
* The orange bar reaches approximately 81%. The lower section of the orange bar reaches approximately 76%. The upper cross-hatched section is approximately 5%.
* **At t=1:**
* The blue bar reaches approximately 84%. The lower section of the blue bar reaches approximately 64%. The upper cross-hatched section is approximately 20%.
* The orange bar reaches approximately 79%. The lower section of the orange bar reaches approximately 74%. The upper cross-hatched section is approximately 5%.
### Key Observations
* The blue bars consistently show a higher success rate than the orange bars at all temperature settings.
* The success rates for both conditions are relatively stable across the different temperature settings.
* The upper cross-hatched section of the blue bars is significantly larger than the upper cross-hatched section of the orange bars.
### Interpretation
The bar chart suggests that the GPT-4o model performs better under the conditions represented by the blue bars compared to the conditions represented by the orange bars across all tested temperature settings. The relatively consistent success rates across different temperatures indicate that the model's performance is not significantly affected by the temperature parameter within the tested range. The difference in the upper cross-hatched sections of the bars suggests that the conditions represented by the blue bars may have a higher proportion of successful outcomes in that specific category. Without a legend, it is impossible to know what the blue and orange bars represent.