\n
## Bar Chart: Project CodeNet Dataset - Success Rate vs. Temperature
### Overview
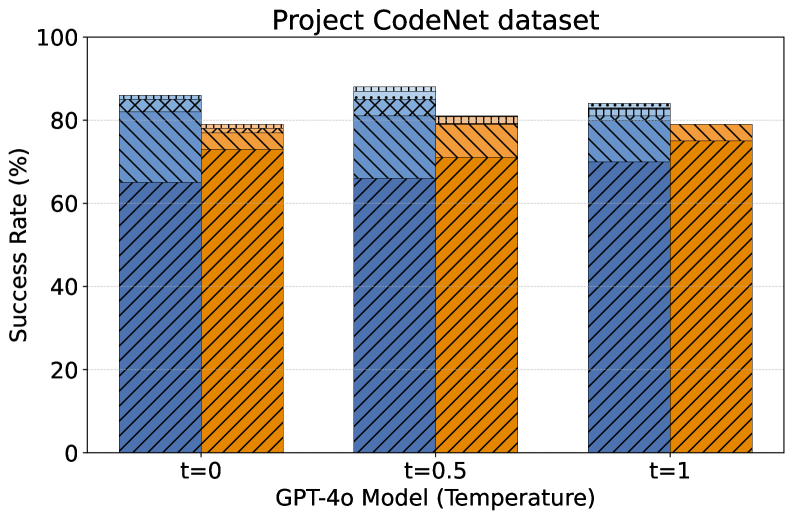
This bar chart visualizes the success rate of the GPT-4o model on the Project CodeNet dataset at three different temperature settings (t=0, t=0.5, and t=1). The success rate is represented as a percentage, with each bar divided into two components, likely representing different aspects of success.
### Components/Axes
* **Title:** Project CodeNet dataset
* **X-axis:** GPT-4o Model (Temperature) - with markers t=0, t=0.5, and t=1.
* **Y-axis:** Success Rate (%) - ranging from 0 to 100.
* **Data Series:** Two stacked bar series are present for each temperature setting.
* Series 1: Dark Blue, with a hatched pattern.
* Series 2: Orange, with a cross-hatched pattern.
* **No explicit legend is provided**, but the color coding is consistent across all bars.
### Detailed Analysis
The chart consists of three groups of stacked bars, one for each temperature setting.
* **t=0:**
* Dark Blue component: Approximately 72%
* Orange component: Approximately 8%
* Total Success Rate: Approximately 80%
* **t=0.5:**
* Dark Blue component: Approximately 75%
* Orange component: Approximately 8%
* Total Success Rate: Approximately 83%
* **t=1:**
* Dark Blue component: Approximately 70%
* Orange component: Approximately 8%
* Total Success Rate: Approximately 78%
The dark blue component dominates the success rate across all temperature settings. The orange component remains relatively constant at around 8% for all temperatures.
### Key Observations
* The highest overall success rate is observed at t=0.5 (approximately 83%).
* The success rate decreases slightly as the temperature increases from 0.5 to 1.
* The orange component contributes a small but consistent portion to the overall success rate.
* The dark blue component shows a slight decrease in success rate as temperature increases.
### Interpretation
The data suggests that the GPT-4o model performs best on the Project CodeNet dataset at a temperature of 0.5. Increasing the temperature to 1 results in a slight decrease in overall success rate. The consistent contribution of the orange component indicates that there's a specific aspect of the task where the model consistently achieves a success rate of around 8%, regardless of the temperature setting.
The temperature parameter in language models controls the randomness of the output. A temperature of 0 makes the output deterministic (always the same for a given input), while higher temperatures introduce more randomness. The observed trend suggests that a moderate level of randomness (t=0.5) is optimal for this particular dataset and task. The slight decrease in performance at t=1 could be due to the increased randomness leading to more incorrect or irrelevant outputs.
The two components of the stacked bars likely represent different facets of success. The dark blue component could represent the primary success metric, while the orange component might represent a secondary or more nuanced aspect of success. Further context about the Project CodeNet dataset and the specific task would be needed to fully interpret the meaning of these components.