## Diagram: State Transition Diagrams
### Overview
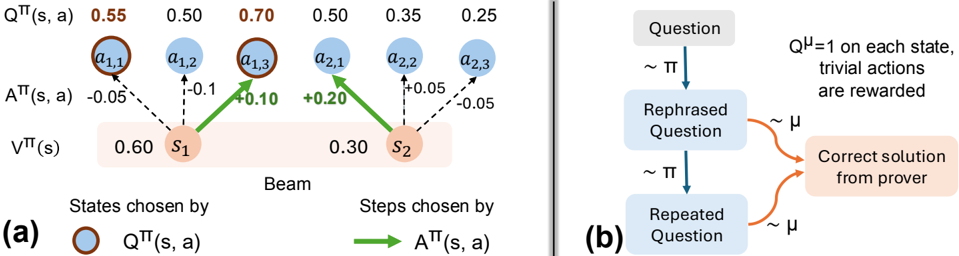
The image presents two diagrams illustrating state transitions. Diagram (a) depicts a beam search process with states, actions, and associated values. Diagram (b) shows a sequence of questions and solutions.
### Components/Axes
**Diagram (a): Beam Search**
* **Nodes:**
* `s1`: State 1, with a value `Vπ(s)` of 0.60. Located on the left side of the "Beam" label.
* `s2`: State 2, with a value `Vπ(s)` of 0.30. Located on the right side of the "Beam" label.
* `a1,1`, `a1,2`, `a1,3`: Actions associated with state `s1`.
* `a2,1`, `a2,2`, `a2,3`: Actions associated with state `s2`.
* **Edges:**
* Dashed black lines represent transitions with negative `Aπ(s, a)` values.
* Solid green lines represent transitions with positive `Aπ(s, a)` values.
* **Values:**
* `Qπ(s, a)`: Q-values for each action. The values are 0.55 for `a1,1`, 0.50 for `a1,2`, 0.70 for `a1,3`, 0.50 for `a2,1`, 0.35 for `a2,2`, and 0.25 for `a2,3`.
* `Aπ(s, a)`: Advantage values for each action. The values are -0.05 for `a1,1`, -0.1 for `a1,2`, +0.10 for `a1,3`, +0.20 for `a2,1`, +0.05 for `a2,2`, and -0.05 for `a2,3`.
* `Vπ(s)`: State values for `s1` (0.60) and `s2` (0.30).
* **Labels:**
* `Qπ(s, a)`: Q-value of state-action pair.
* `Aπ(s, a)`: Advantage of state-action pair.
* `Vπ(s)`: Value of state.
* "Beam": Indicates the beam search process.
* "States chosen by": Label for the states.
* "Steps chosen by": Label for the actions.
* **Legend:**
* Brown-outlined blue circle: `Qπ(s, a)`
* Green arrow: `Aπ(s, a)`
**Diagram (b): Question-Answering Process**
* **Nodes:**
* "Question": Initial question.
* "Rephrased Question": Rephrased version of the question.
* "Repeated Question": Repeated version of the question.
* "Correct solution from prover": The correct solution.
* **Edges:**
* Blue arrows labeled "~ π": Transitions between question states.
* Orange arrows labeled "~ μ": Transitions from question states to the correct solution.
* **Text:**
* "Qμ = 1 on each state, trivial actions are rewarded": Describes the reward structure.
### Detailed Analysis
**Diagram (a): Beam Search**
* The beam search starts with two states, `s1` and `s2`, having values 0.60 and 0.30, respectively.
* From `s1`, actions `a1,1`, `a1,2`, and `a1,3` are possible, with Q-values 0.55, 0.50, and 0.70, and advantages -0.05, -0.1, and +0.10, respectively.
* From `s2`, actions `a2,1`, `a2,2`, and `a2,3` are possible, with Q-values 0.50, 0.35, and 0.25, and advantages +0.20, +0.05, and -0.05, respectively.
* The actions with positive advantages (green arrows) are `a1,3` from `s1` and `a2,1` from `s2`.
**Diagram (b): Question-Answering Process**
* The process starts with a "Question".
* The question is rephrased, leading to a "Rephrased Question".
* The rephrased question is repeated, leading to a "Repeated Question".
* From both the "Rephrased Question" and "Repeated Question", the process can transition to the "Correct solution from prover".
* The transitions between question states are governed by a policy π, while the transitions to the correct solution are governed by a policy μ.
* The text indicates that Qμ = 1 on each state, and trivial actions are rewarded.
### Key Observations
* In diagram (a), the Q-values and advantage values vary for different actions from each state.
* In diagram (b), the question-answering process involves rephrasing and repeating the question before arriving at the correct solution.
### Interpretation
The diagrams illustrate two different processes. Diagram (a) shows a beam search algorithm, where the algorithm explores different actions from different states, guided by Q-values and advantage values. Diagram (b) depicts a question-answering process, where the question is iteratively refined before a solution is obtained. The use of policies π and μ suggests a reinforcement learning framework for question answering. The statement "Qμ = 1 on each state, trivial actions are rewarded" implies that the reward structure favors actions that lead to the correct solution, even if they are trivial.