TECHNICAL ASSET FINGERPRINT
99383fee17cc8abf6470b9aa
Click to view fullscreen
Press ESC or click to close
FOUND IN PAPERS
EXPERT: healer-alpha-free VERSION 1
RUNTIME: free/openrouter/healer-alpha
INTEL_VERIFIED
## Technical Diagram: Beam Search Visualization and Question Rephrasing Flowchart
### Overview
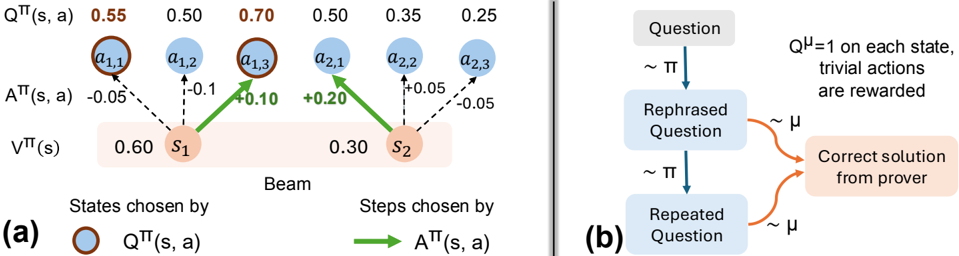
The image contains two distinct technical diagrams, labeled (a) and (b), presented side-by-side. Diagram (a) is a visualization of a beam search process in a reinforcement learning or decision-making context, showing states, actions, and associated values. Diagram (b) is a flowchart illustrating a process involving question rephrasing and solution generation, likely for a language model or reasoning system.
### Components/Axes
**Diagram (a) - Left Side:**
* **Title/Label:** "(a)" at the bottom-left corner.
* **Main Structure:** A "Beam" search diagram with two primary states, `s₁` and `s₂`, represented as orange circles within a light orange rectangular background.
* **States:** `s₁` (left) and `s₂` (right).
* **Actions:** Six blue circular nodes representing actions, arranged in two rows above the states.
* Top row (from left to right): `a₁,₁`, `a₁,₂`, `a₁,₃`, `a₂,₁`, `a₂,₂`, `a₂,₃`.
* **Value Labels (Top Row):** Above each action node, a numerical value labeled `Q^π(s, a)`:
* Above `a₁,₁`: `0.55` (in orange text)
* Above `a₁,₂`: `0.50`
* Above `a₁,₃`: `0.70` (in orange text)
* Above `a₂,₁`: `0.50`
* Above `a₂,₂`: `0.35`
* Above `a₂,₃`: `0.25`
* **Advantage Labels (Middle):** Between the action nodes and states, values labeled `A^π(s, a)`:
* Between `a₁,₁` and `s₁`: `-0.05`
* Between `a₁,₂` and `s₁`: `-0.1`
* Between `a₁,₃` and `s₁`: `+0.10` (in green text)
* Between `a₂,₁` and `s₂`: `+0.20` (in green text)
* Between `a₂,₂` and `s₂`: `+0.05`
* Between `a₂,₃` and `s₂`: `-0.05`
* **State Values (Bottom):** Below the states, values labeled `V^π(s)`:
* Below `s₁`: `0.60`
* Below `s₂`: `0.30`
* **Legend (Bottom of Diagram a):**
* Left side: An orange circle icon followed by the text "States chosen by `Q^π(s, a)`".
* Right side: A green arrow icon followed by the text "Steps chosen by `A^π(s, a)`".
* **Visual Flow:** Solid green arrows point from `s₁` to `a₁,₃` and from `s₂` to `a₂,₁`. Dashed black arrows connect states to all their respective action nodes.
**Diagram (b) - Right Side:**
* **Title/Label:** "(b)" at the bottom-left corner.
* **Main Structure:** A vertical flowchart with three main rectangular boxes connected by arrows.
* **Flowchart Boxes (from top to bottom):**
1. Top box: "Question"
2. Middle box: "Rephrased Question"
3. Bottom box: "Repeated Question"
* **Flow Arrows & Annotations:**
* A blue arrow points from "Question" to "Rephrased Question", labeled with "~ π".
* A blue arrow points from "Rephrased Question" to "Repeated Question", labeled with "~ π".
* Two orange curved arrows point from the right side of both the "Rephrased Question" and "Repeated Question" boxes to a final box on the right. These arrows are labeled with "~ μ".
* **Final Output Box:** A light orange box on the right containing the text: "Correct solution from prover".
* **Annotation Text (Top-Right):** "Q^μ=1 on each state, trivial actions are rewarded".
### Detailed Analysis
**Diagram (a) Analysis:**
* **Spatial Grounding:** The legend is positioned at the bottom of the diagram. The orange "States chosen" icon corresponds to the orange circles for `s₁` and `s₂`. The green "Steps chosen" arrow corresponds to the two solid green arrows in the main diagram.
* **Trend Verification & Data Points:**
* For state `s₁`: The chosen action (green arrow) is `a₁,₃`, which has the highest `Q^π(s, a)` value (0.70) and a positive advantage `A^π(s, a)` (+0.10). The other actions from `s₁` (`a₁,₁` and `a₁,₂`) have lower Q-values and negative advantages.
* For state `s₂`: The chosen action (green arrow) is `a₂,₁`, which has the highest `Q^π(s, a)` value (0.50) among actions from `s₂` and the highest positive advantage `A^π(s, a)` (+0.20).
* The state value `V^π(s)` for `s₁` (0.60) is higher than for `s₂` (0.30).
* **Component Isolation:** The diagram is segmented into a top layer (Q-values), a middle layer (actions and advantages), and a bottom layer (states and state values). The legend is a separate explanatory component.
**Diagram (b) Analysis:**
* **Flow:** The primary flow is vertical: `Question` → `Rephrased Question` → `Repeated Question`. A secondary, convergent flow comes from both the rephrased and repeated questions to generate the final "Correct solution".
* **Process Labels:** The "~ π" and "~ μ" labels likely denote different policies, models, or processes applied at each step. The annotation clarifies that under policy `μ`, the Q-value is 1 for each state, and trivial actions receive rewards.
### Key Observations
1. **Diagram (a):** The beam search selects actions based on a combination of high Q-value (`Q^π(s, a)`) and positive advantage (`A^π(s, a)`). The chosen actions (`a₁,₃` and `a₂,₁`) are not necessarily the ones with the absolute highest Q-value in the entire set (e.g., `a₁,₁` has Q=0.55, which is higher than `a₂,₁`'s Q=0.50), but they are the best *for their respective parent states*.
2. **Diagram (a):** The advantage function `A^π(s, a)` appears to be calculated as `Q^π(s, a) - V^π(s)`. For example, for `s₁` and `a₁,₃`: 0.70 - 0.60 = +0.10, which matches the labeled advantage.
3. **Diagram (b):** The process suggests that rephrasing a question (using process `π`) and then potentially repeating it can lead to a correct solution when processed by a different system or policy (`μ`). The note implies that under `μ`, the task is simplified (Q^μ=1, trivial actions rewarded).
### Interpretation
These diagrams together likely illustrate components of a system for improving reasoning or problem-solving, possibly in the context of large language models or reinforcement learning from human feedback.
* **Diagram (a)** demonstrates a principled method for selecting the most promising partial solutions (actions) during a search process. It shows that the selection isn't greedy based on a single metric but considers both the expected return (`Q`) and how much better an action is compared to the average for that state (`A`). This is a core concept in advanced reinforcement learning algorithms.
* **Diagram (b)** proposes a meta-strategy: transforming the input (the question) through rephrasing and repetition can make the underlying problem more tractable for a solver (the "prover"). The different policies (`π` for transformation, `μ` for solving) suggest a separation of concerns—one system prepares the problem, and another, perhaps more specialized or reward-sensitive system, solves it.
* **Connection:** The "beam search" in (a) could be the mechanism used by the "prover" in (b) to explore possible solution paths after receiving a rephrased or repeated question. The reward structure mentioned in (b) (`Q^μ=1, trivial actions are rewarded`) would directly influence the `Q` and `A` values calculated in a process like (a).
**Language Declaration:** All text in the image is in English, with standard mathematical notation (Greek letters π, μ).
DECODING INTELLIGENCE...