## Diagram: Reinforcement Learning Process with Question Refinement
### Overview
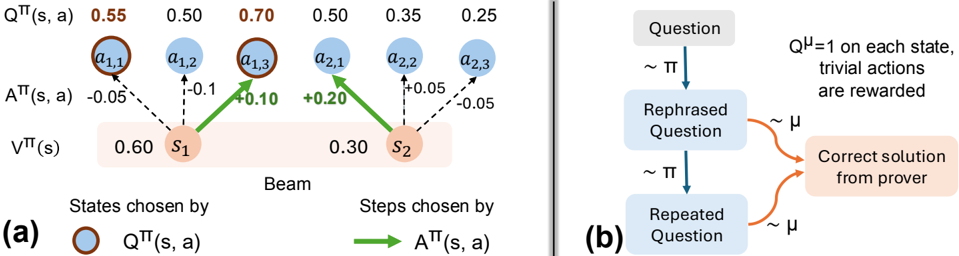
The image contains two interconnected diagrams:
**(a)** A reinforcement learning (RL) process modeling state-action dynamics with numerical values for Q-values, advantage functions, and state values.
**(b)** A flowchart illustrating a question refinement process leading to a correct solution, with probabilistic transitions and rewards.
---
### Components/Axes
#### Diagram (a): RL Process
- **States**:
- `S1` (value: 0.60)
- `S2` (value: 0.30)
- **Actions**:
- `a1,1`, `a1,2`, `a1,3` (associated with `S1`)
- `a2,1`, `a2,2`, `a2,3` (associated with `S2`)
- **Key Labels**:
- `QTT(s, a)`: Action-value function (blue circles)
- `ATT(s, a)`: Advantage function (green arrows)
- `VTT(s)`: State-value function (orange boxes)
- `Beam`: Mechanism selecting states/actions
- **Legend**:
- Blue circles: `QTT(s, a)`
- Brown circles: `ATT(s, a)`
- Green arrows: `ATT(s, a)` transitions
#### Diagram (b): Question Refinement
- **Nodes**:
- `Question` → `Rephrased Question` → `Repeated Question` → `Correct solution from prover`
- **Transitions**:
- `~π`: Probabilistic transition (e.g., rephrasing)
- `~μ`: Reward mechanism (trivial actions rewarded)
- **Legend**:
- `Qμ=1`: Reward for trivial actions
---
### Detailed Analysis
#### Diagram (a): RL Process
- **Q-values (`QTT(s, a)`)**:
- `S1` actions: 0.55, 0.50, 0.70
- `S2` actions: 0.50, 0.35, 0.25
- **Trend**: Q-values decrease from `a1,3` (0.70) to `a2,3` (0.25).
- **Advantage values (`ATT(s, a)`)**:
- `S1` transitions: -0.05, -0.10, +0.10
- `S2` transitions: +0.20, -0.05
- **Trend**: Mixed positive/negative advantages; `S2` has a larger positive shift (+0.20).
- **State values (`VTT(s)`)**:
- `S1`: 0.60
- `S2`: 0.30
- **Trend**: State values decrease from `S1` to `S2`.
#### Diagram (b): Question Refinement
- **Flow**:
- `Question` → `Rephrased Question` (via `~π`) → `Repeated Question` (via `~π`) → `Correct solution` (via `~μ`).
- **Rewards**:
- `Qμ=1` ensures trivial actions (e.g., rephrasing) are rewarded.
---
### Key Observations
1. **RL Process (a)**:
- `S1` has higher Q-values and state value than `S2`, suggesting it is a more favorable state.
- `a1,3` (Q=0.70) is the optimal action in `S1`, while `a2,3` (Q=0.25) is suboptimal in `S2`.
- Advantage values indicate exploration incentives (e.g., +0.20 for `a2,1`).
2. **Question Refinement (b)**:
- Iterative rephrasing (`~π`) and repetition (`~π`) lead to a correct solution, with rewards (`~μ`) guiding the process.
---
### Interpretation
- **RL Process (a)**:
The beam selects states (`S1`, `S2`) based on `QTT` and `ATT` values. Higher Q-values in `S1` suggest it is prioritized, while `ATT` values guide action selection within states. The decline in `VTT` from `S1` to `S2` implies diminishing returns in later states.
- **Question Refinement (b)**:
The process mirrors RL exploration: rephrasing (`~π`) and repetition (`~π`) refine the question, while rewards (`~μ`) reinforce progress toward the correct solution. The `Qμ=1` condition ensures trivial steps are incentivized, aligning with the RL framework’s reward structure.
- **Integration**:
Diagram (a) models the agent’s decision-making, while (b) abstracts the cognitive process of refining questions. Both emphasize iterative improvement guided by value functions and rewards.
---
### Uncertainties
- Numerical values in (a) are approximate (e.g., 0.55 ±0.05).
- The exact relationship between `~π` and `~μ` in (b) is not quantified.