## Line Graph: Training Loss Over Steps
### Overview
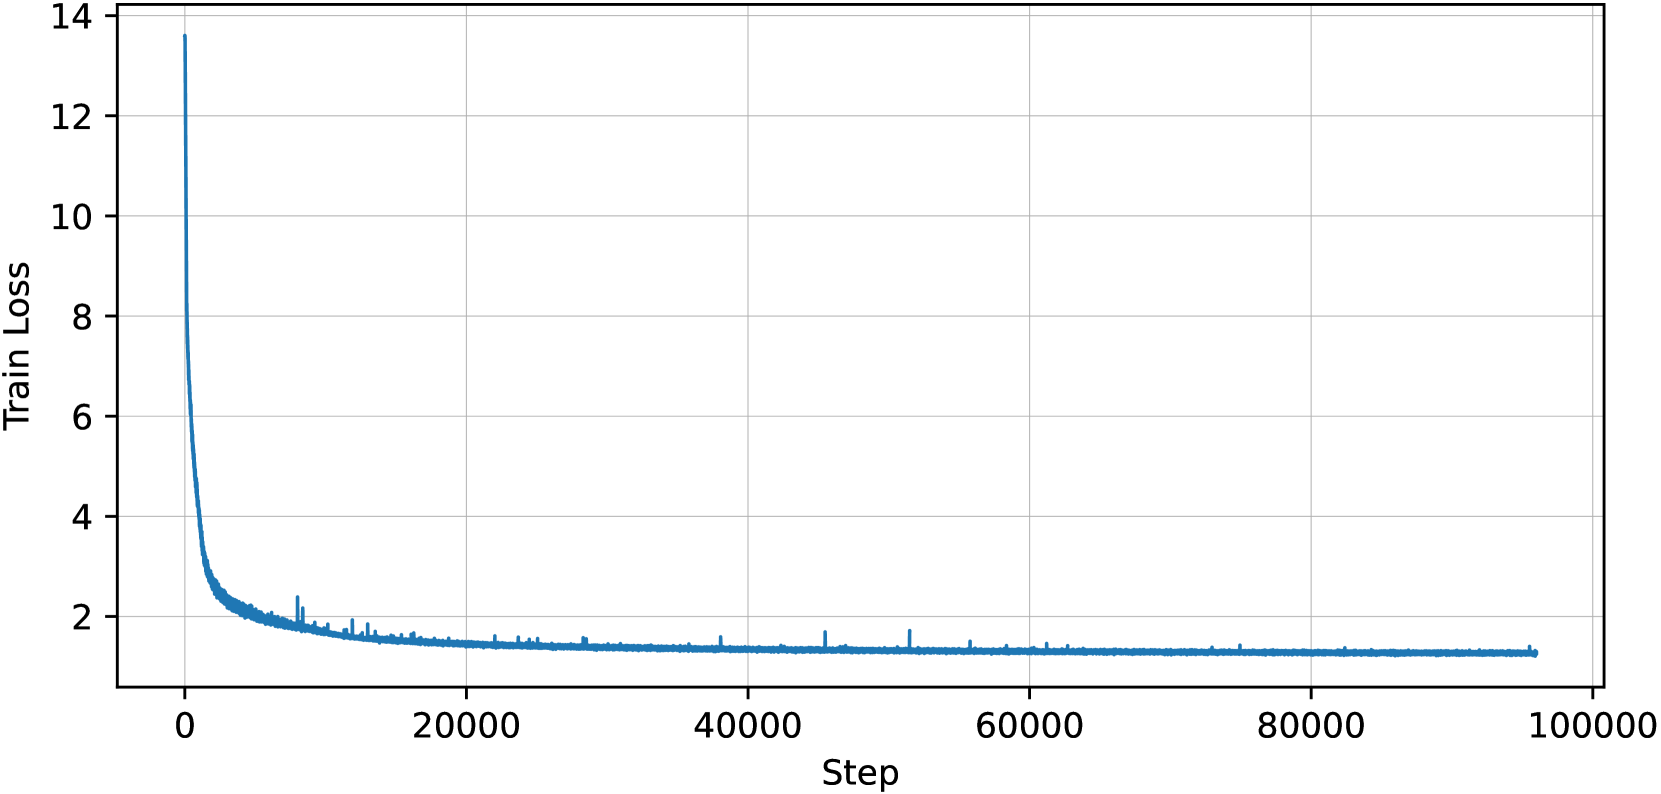
The graph depicts the evolution of training loss across 100,000 optimization steps. A single blue line dominates the plot, showing a sharp initial decline followed by stabilization. The y-axis (Train Loss) ranges from 0 to 14, while the x-axis (Step) spans 0 to 100,000. Minor fluctuations occur after the initial drop but remain within a narrow band.
### Components/Axes
- **X-axis (Step)**: Labeled "Step" with increments at 0, 20,000, 40,000, 60,000, 80,000, and 100,000.
- **Y-axis (Train Loss)**: Labeled "Train Loss" with increments at 0, 2, 4, 6, 8, 10, 12, and 14.
- **Legend**: Positioned in the top-left corner, indicating the blue line represents "Train Loss" (no explicit legend text visible in the image).
### Detailed Analysis
- **Initial Drop**: At step 0, the loss starts at approximately **13.5**. It plunges vertically to ~2.5 by step 10,000, with a steep gradient.
- **Stabilization**: From step 20,000 onward, the loss plateaus around **1.5**, with minor oscillations (±0.1–0.2) persisting until step 100,000.
- **Notable Features**:
- A single outlier spike (~1.8) occurs near step 50,000 but quickly reverts to the baseline.
- No additional data series or annotations are present.
### Key Observations
1. **Rapid Convergence**: The loss decreases by ~90% within the first 10,000 steps.
2. **Stable Training**: Post-step 20,000, the loss remains nearly constant, suggesting model convergence.
3. **Minimal Noise**: Post-convergence fluctuations are negligible, indicating robust training dynamics.
### Interpretation
The graph illustrates a typical machine learning training curve where the model rapidly reduces error during early optimization, followed by stabilization as it approaches optimal parameters. The initial sharp decline reflects the model's sensitivity to initial parameter adjustments, while the plateau indicates diminishing returns in further training. The absence of overfitting or divergence suggests well-tuned hyperparameters and a stable loss landscape. The outlier at step 50,000 may represent a transient numerical artifact or a brief gradient instability, but its impact is negligible in the long-term trend.