## Line Graphs: Inner Product Error and MSE vs Bit-width
### Overview
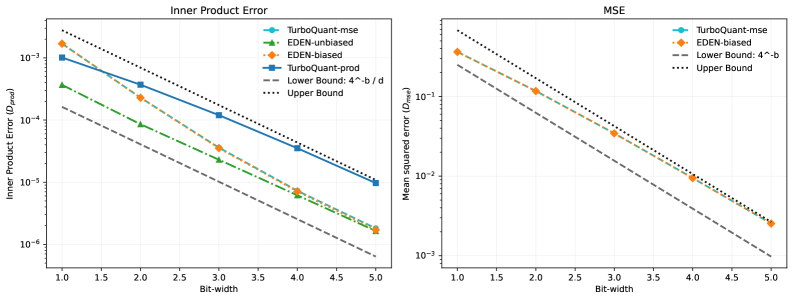
The image contains two line graphs comparing error metrics (Inner Product Error and Mean Squared Error) across different bit-widths (1.0 to 5.0). Both graphs include multiple data series, theoretical bounds, and logarithmic y-axes. The legends are positioned on the right side of each graph.
---
### Components/Axes
#### Left Graph (Inner Product Error)
- **X-axis**: Bit-width (1.0 to 5.0, linear scale)
- **Y-axis**: Inner Product Error (1e-6 to 1e-3, logarithmic scale)
- **Legend**:
- TurboQuant-mse (blue circles)
- EDEN-unbiased (green triangles)
- EDEN-biased (orange diamonds)
- TurboQuant-prod (blue squares)
- Lower Bound: 4^-b/d (dashed gray line)
- Upper Bound: 4^-b/d (dotted gray line)
#### Right Graph (MSE)
- **X-axis**: Bit-width (1.0 to 5.0, linear scale)
- **Y-axis**: Mean Squared Error (1e-3 to 1e-1, logarithmic scale)
- **Legend**:
- TurboQuant-mse (blue circles)
- EDEN-biased (orange diamonds)
- Lower Bound: 4^-b (dashed gray line)
- Upper Bound: 4^-b (dotted gray line)
---
### Detailed Analysis
#### Left Graph (Inner Product Error)
1. **TurboQuant-mse** (blue circles):
- Starts at ~1e-3 (Bit-width 1.0), decreases to ~1e-5 (Bit-width 5.0).
- Follows a steep downward trend.
2. **EDEN-unbiased** (green triangles):
- Starts at ~1e-4 (Bit-width 1.0), decreases to ~1e-6 (Bit-width 5.0).
- Slightly below TurboQuant-mse at all points.
3. **EDEN-biased** (orange diamonds):
- Starts at ~1e-3 (Bit-width 1.0), decreases to ~1e-5 (Bit-width 5.0).
- Overlaps with TurboQuant-mse at lower Bit-widths but diverges slightly at higher Bit-widths.
4. **TurboQuant-prod** (blue squares):
- Starts at ~1e-3 (Bit-width 1.0), decreases to ~1e-5 (Bit-width 5.0).
- Nearly identical to TurboQuant-mse.
5. **Bounds**:
- Lower Bound (dashed gray): ~1e-4 to ~1e-6.
- Upper Bound (dotted gray): ~1e-3 to ~1e-5.
#### Right Graph (MSE)
1. **TurboQuant-mse** (blue circles):
- Starts at ~1e-1 (Bit-width 1.0), decreases to ~1e-3 (Bit-width 5.0).
- Steep downward trend.
2. **EDEN-biased** (orange diamonds):
- Starts at ~1e-1 (Bit-width 1.0), decreases to ~1e-3 (Bit-width 5.0).
- Parallel to TurboQuant-mse but slightly higher at all points.
3. **Bounds**:
- Lower Bound (dashed gray): ~1e-2 to ~1e-4.
- Upper Bound (dotted gray): ~1e-1 to ~1e-3.
---
### Key Observations
1. **Error Reduction**: All data series show a consistent decrease in error as Bit-width increases.
2. **Convergence**: TurboQuant-mse and EDEN-biased lines in the MSE graph are nearly identical, suggesting similar performance.
3. **Bounds**: Theoretical bounds (dashed/dotted lines) tightly enclose the data series, indicating the errors are well-constrained.
4. **Divergence**: In the Inner Product Error graph, EDEN-unbiased (green triangles) consistently underperforms other methods.
---
### Interpretation
1. **Bit-width Impact**: Higher Bit-widths significantly reduce both Inner Product Error and MSE, validating the effectiveness of increased precision.
2. **Method Comparison**:
- TurboQuant-mse and EDEN-biased perform similarly in MSE, while EDEN-unbiased excels in Inner Product Error.
- The bounds suggest a theoretical limit to error reduction, with all methods approaching the lower bound as Bit-width increases.
3. **Practical Implications**: The convergence of TurboQuant-mse and EDEN-biased in MSE implies that bias mitigation (EDEN-unbiased) may be more critical for Inner Product Error than for MSE.
---
### Spatial Grounding & Verification
- **Legend Alignment**: All line colors/markers match their legend labels (e.g., blue circles = TurboQuant-mse).
- **Trend Verification**:
- Left graph: All lines slope downward, with EDEN-unbiased being the steepest.
- Right graph: TurboQuant-mse and EDEN-biased lines are parallel, both steeper than the bounds.
- **Component Isolation**:
- Left graph focuses on Inner Product Error with tighter bounds (4^-b/d).
- Right graph focuses on MSE with looser bounds (4^-b).
---
### Content Details
- **Inner Product Error Values** (approximate):
- TurboQuant-mse: 1e-3 → 1e-5
- EDEN-unbiased: 1e-4 → 1e-6
- EDEN-biased: 1e-3 → 1e-5
- TurboQuant-prod: 1e-3 → 1e-5
- **MSE Values** (approximate):
- TurboQuant-mse: 1e-1 → 1e-3
- EDEN-biased: 1e-1 → 1e-3
---
### Final Notes
The graphs demonstrate that increasing Bit-width reduces error across all methods, with EDEN-unbiased showing the most significant improvement in Inner Product Error. The bounds provide a theoretical framework for evaluating method performance, with all data series approaching the lower bound as Bit-width increases.